Power BI and Excel have several similarities regarding their functionalities, data presentation, and how we connect data to multiple sources. Compared to Power BI, Excel is a significantly easier tool to use. However, the advantage that Power BI brings is its visualization capabilities. Additionally, it is worth noting that Excel has limited report-sharing capabilities, which is a functionality where Power BI is superior.
Microsoft’s Power BI is a business analytics tool that can be used for the creation of dashboards and reports that consist of millions of rows of data. Excel, which is also a Microsoft tool, has different built-in capabilities and functionalities for mathematical calculations, iterations, forecasts, and the creation of graphs and tables.
Most Important Distinctions
Visualization and Business Intelligence
The Excel tool is primarily used for spreadsheets and has limited capabilities for data visualization. Although it can be used for graphs and charts, its capacity for complex data analytics and visualization is limited.
In contrast, Power BI is a tailor-made tool for Business Intelligence and data visualization. Power BI enables its users to create interactive and dynamic control tables, reports, and visualizations. It is purposefully crafted for handling large databases and presenting information in a manner that is visually appealing and easy for users to understand.
Relational Data Model
Excel supports basic relational data modeling between databases. The process of connecting and changing relationships is done manually and is not intuitive for working with complex datasets.
On the other hand, Power BI enables users to easily create relationships between different tables and other data sources through built-in data source connectors. This makes it easy to import and update the data. Additionally, Power BI provides a more advanced approach to creating relationships, making it efficient for managing and analyzing complex data structures that are stored both locally and in the cloud.
Collaboration and Sharing
Anyone who has ever worked with Excel probably knows that its table collaboration and sharing functionality is a big challenge, especially when it comes to working with multiple versions of a single table. Sharing via Excel usually includes sending entire folders that contain multiple files, which can lead to data inconsistencies.
Power BI, however, was explicitly designed for data sharing. It allows users to publish and share reports and control tables easily, provides real-time user collaboration, and offers the ability to embed reports into websites or applications.
Automation of Data Refreshes
Doing a data refresh in Excel might require manual intervention, and automating this process is complex.
Meanwhile, Power BI offers seamless data refresh capabilities, allowing users to schedule automatic data refreshes.
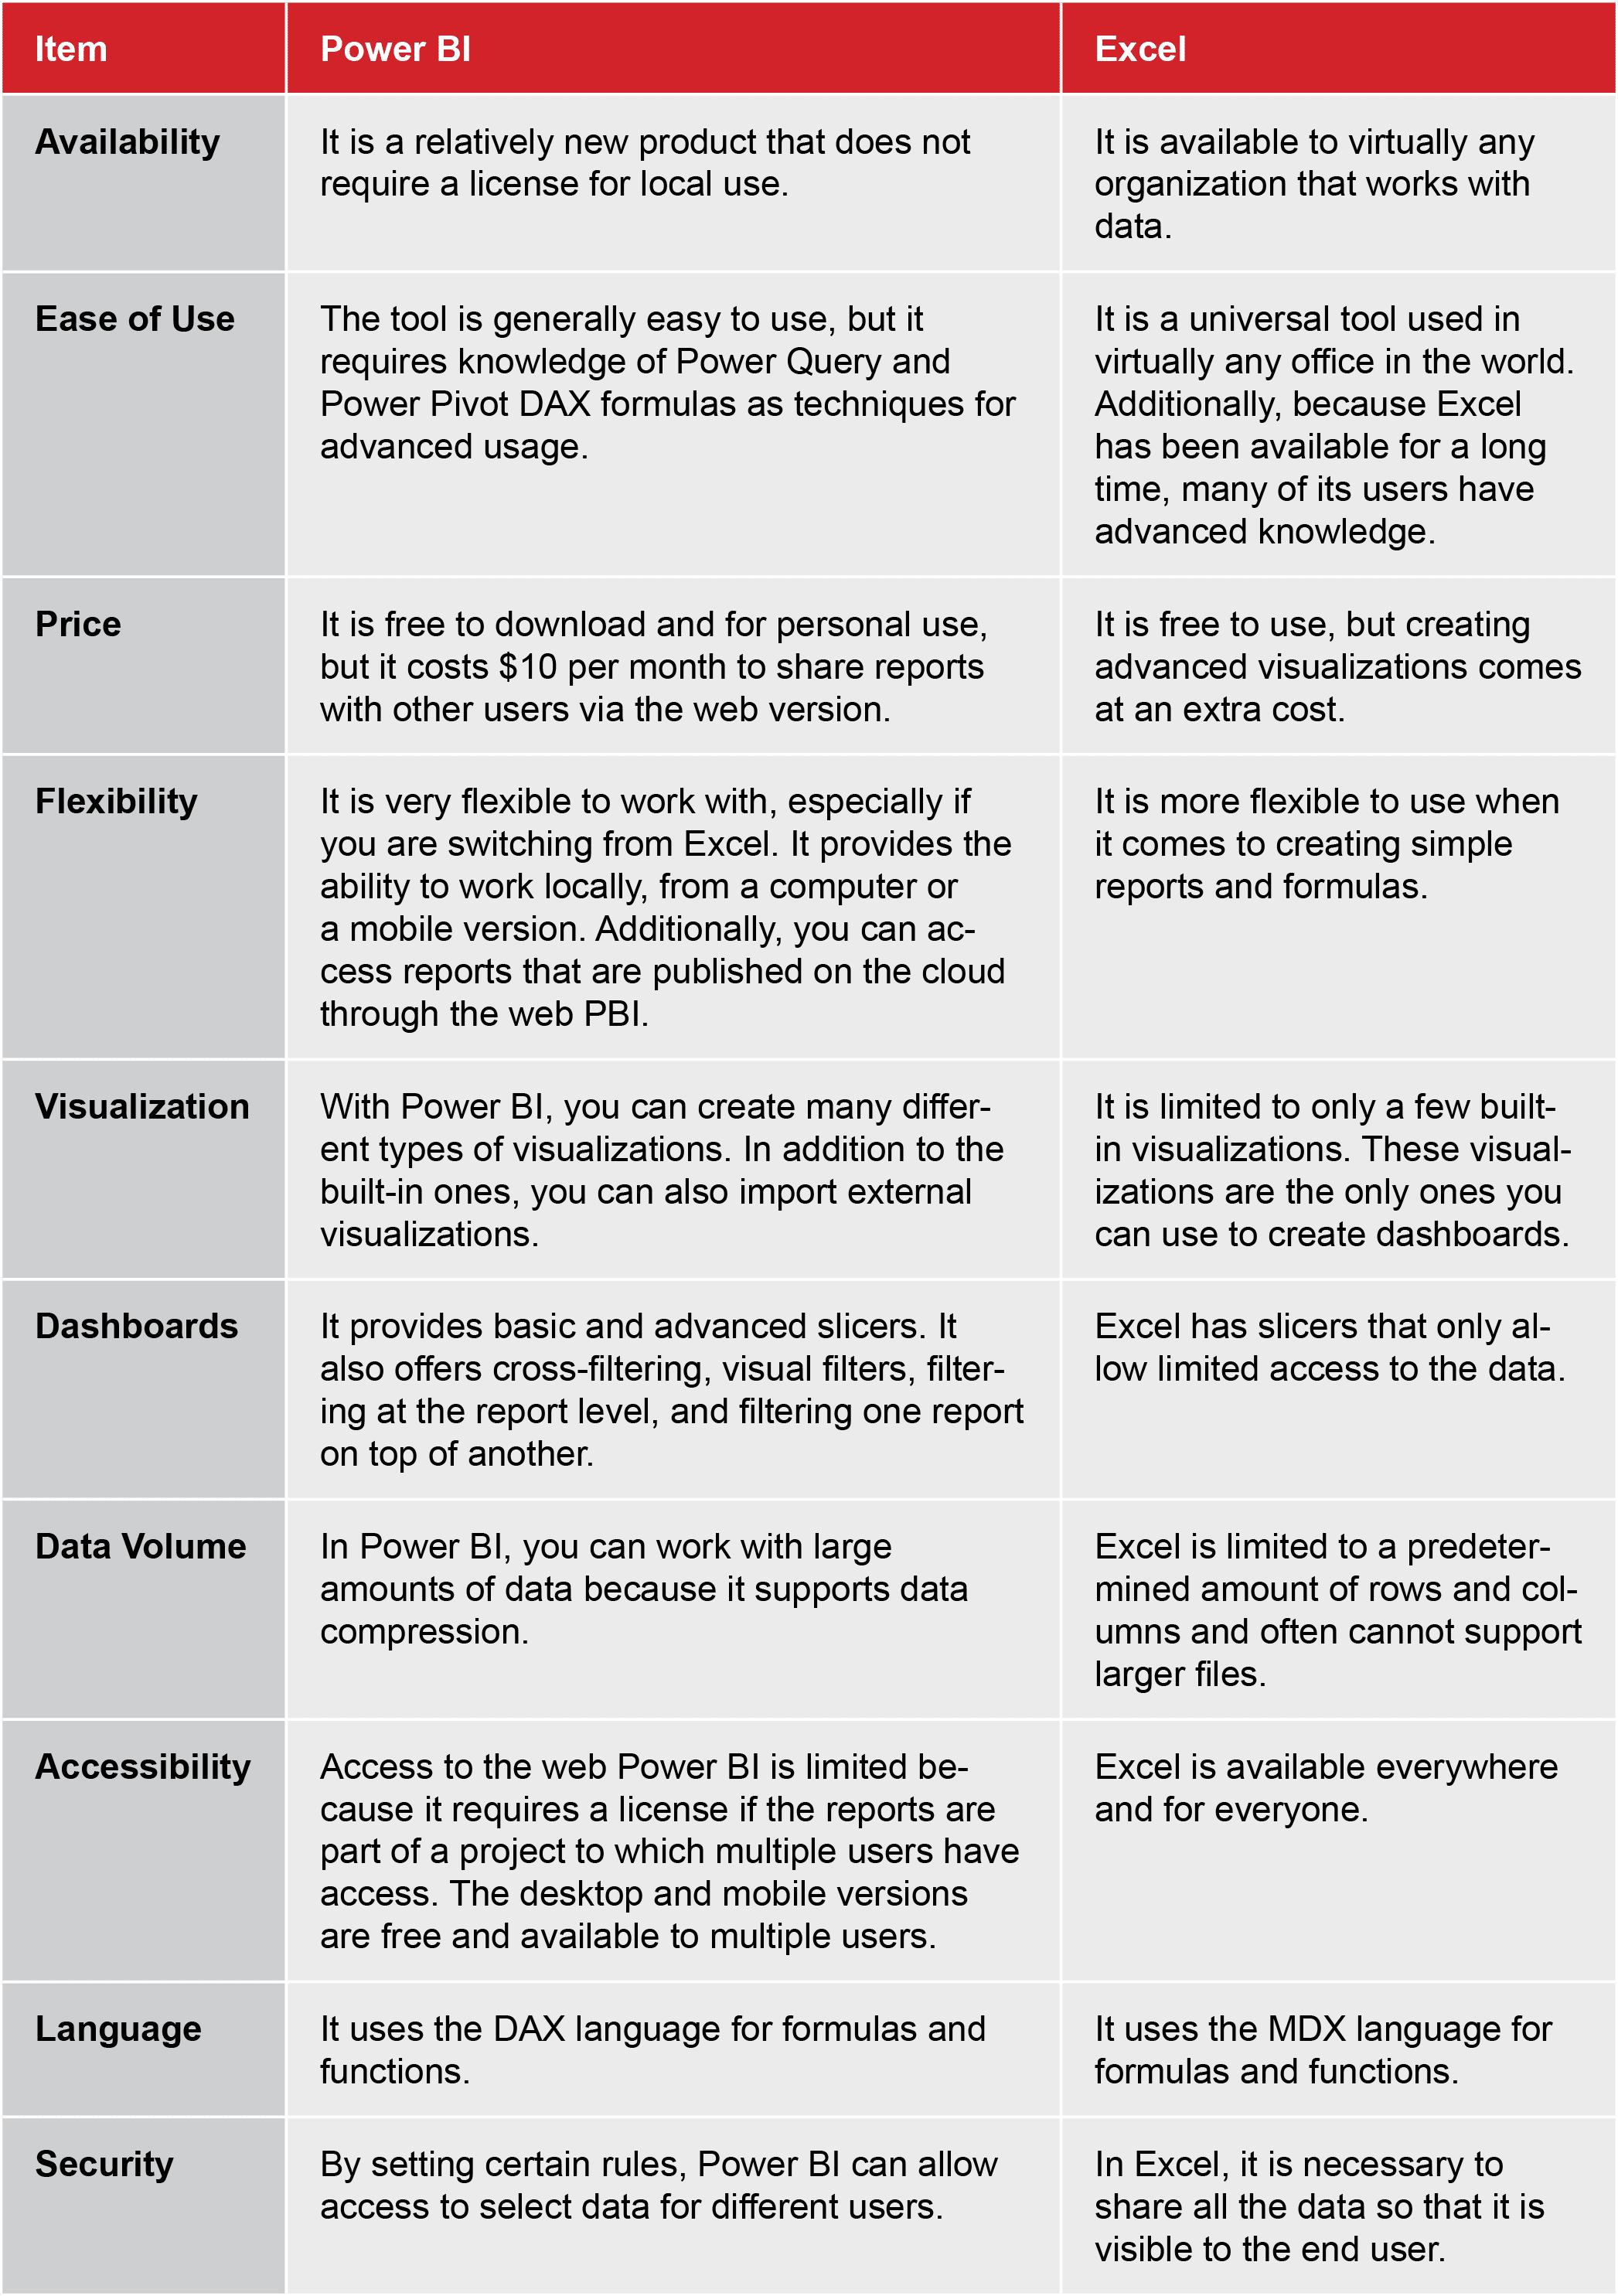
Comparison Table
DAX Functions in Excel vs Power BI
Another key difference between the tools concerns DAX functions and how they can be used in each one. But before we dive into DAX usage in Excel and Power BI, let’s first see what DAX actually is.
What is DAX?
DAX, or Data Analysis Expressions, is a formula language specifically used by Microsoft Power BI and Excel. It enables users to carry out custom calculations on data models created in Power BI, Excel, and SSAS (SQL Server Analysis Services).
Additionally, the DAX language includes a library of functions, constants, and operators that users can use to build formulas. So, in essence, DAX is to Power BI what VBA is to Excel.
The process of creating a DAX formula is also similar to creating one in Excel. You first need to type in an equal (=) sign, then a name or expression, and at the end, you add any required arguments and/or values.
However, although they are pretty similar to traditional Excel functions, DAX functions have several key distinctions:
- DAX functions are engineered to work with relational data and perform dynamic aggregation.
- They offer a more sophisticated and advanced way to manipulate various types of data, including character data, date and time, and time intelligence functions.
- DAX functions allow you to customize calculations on a row-by-row basis with different levels of data granularity.
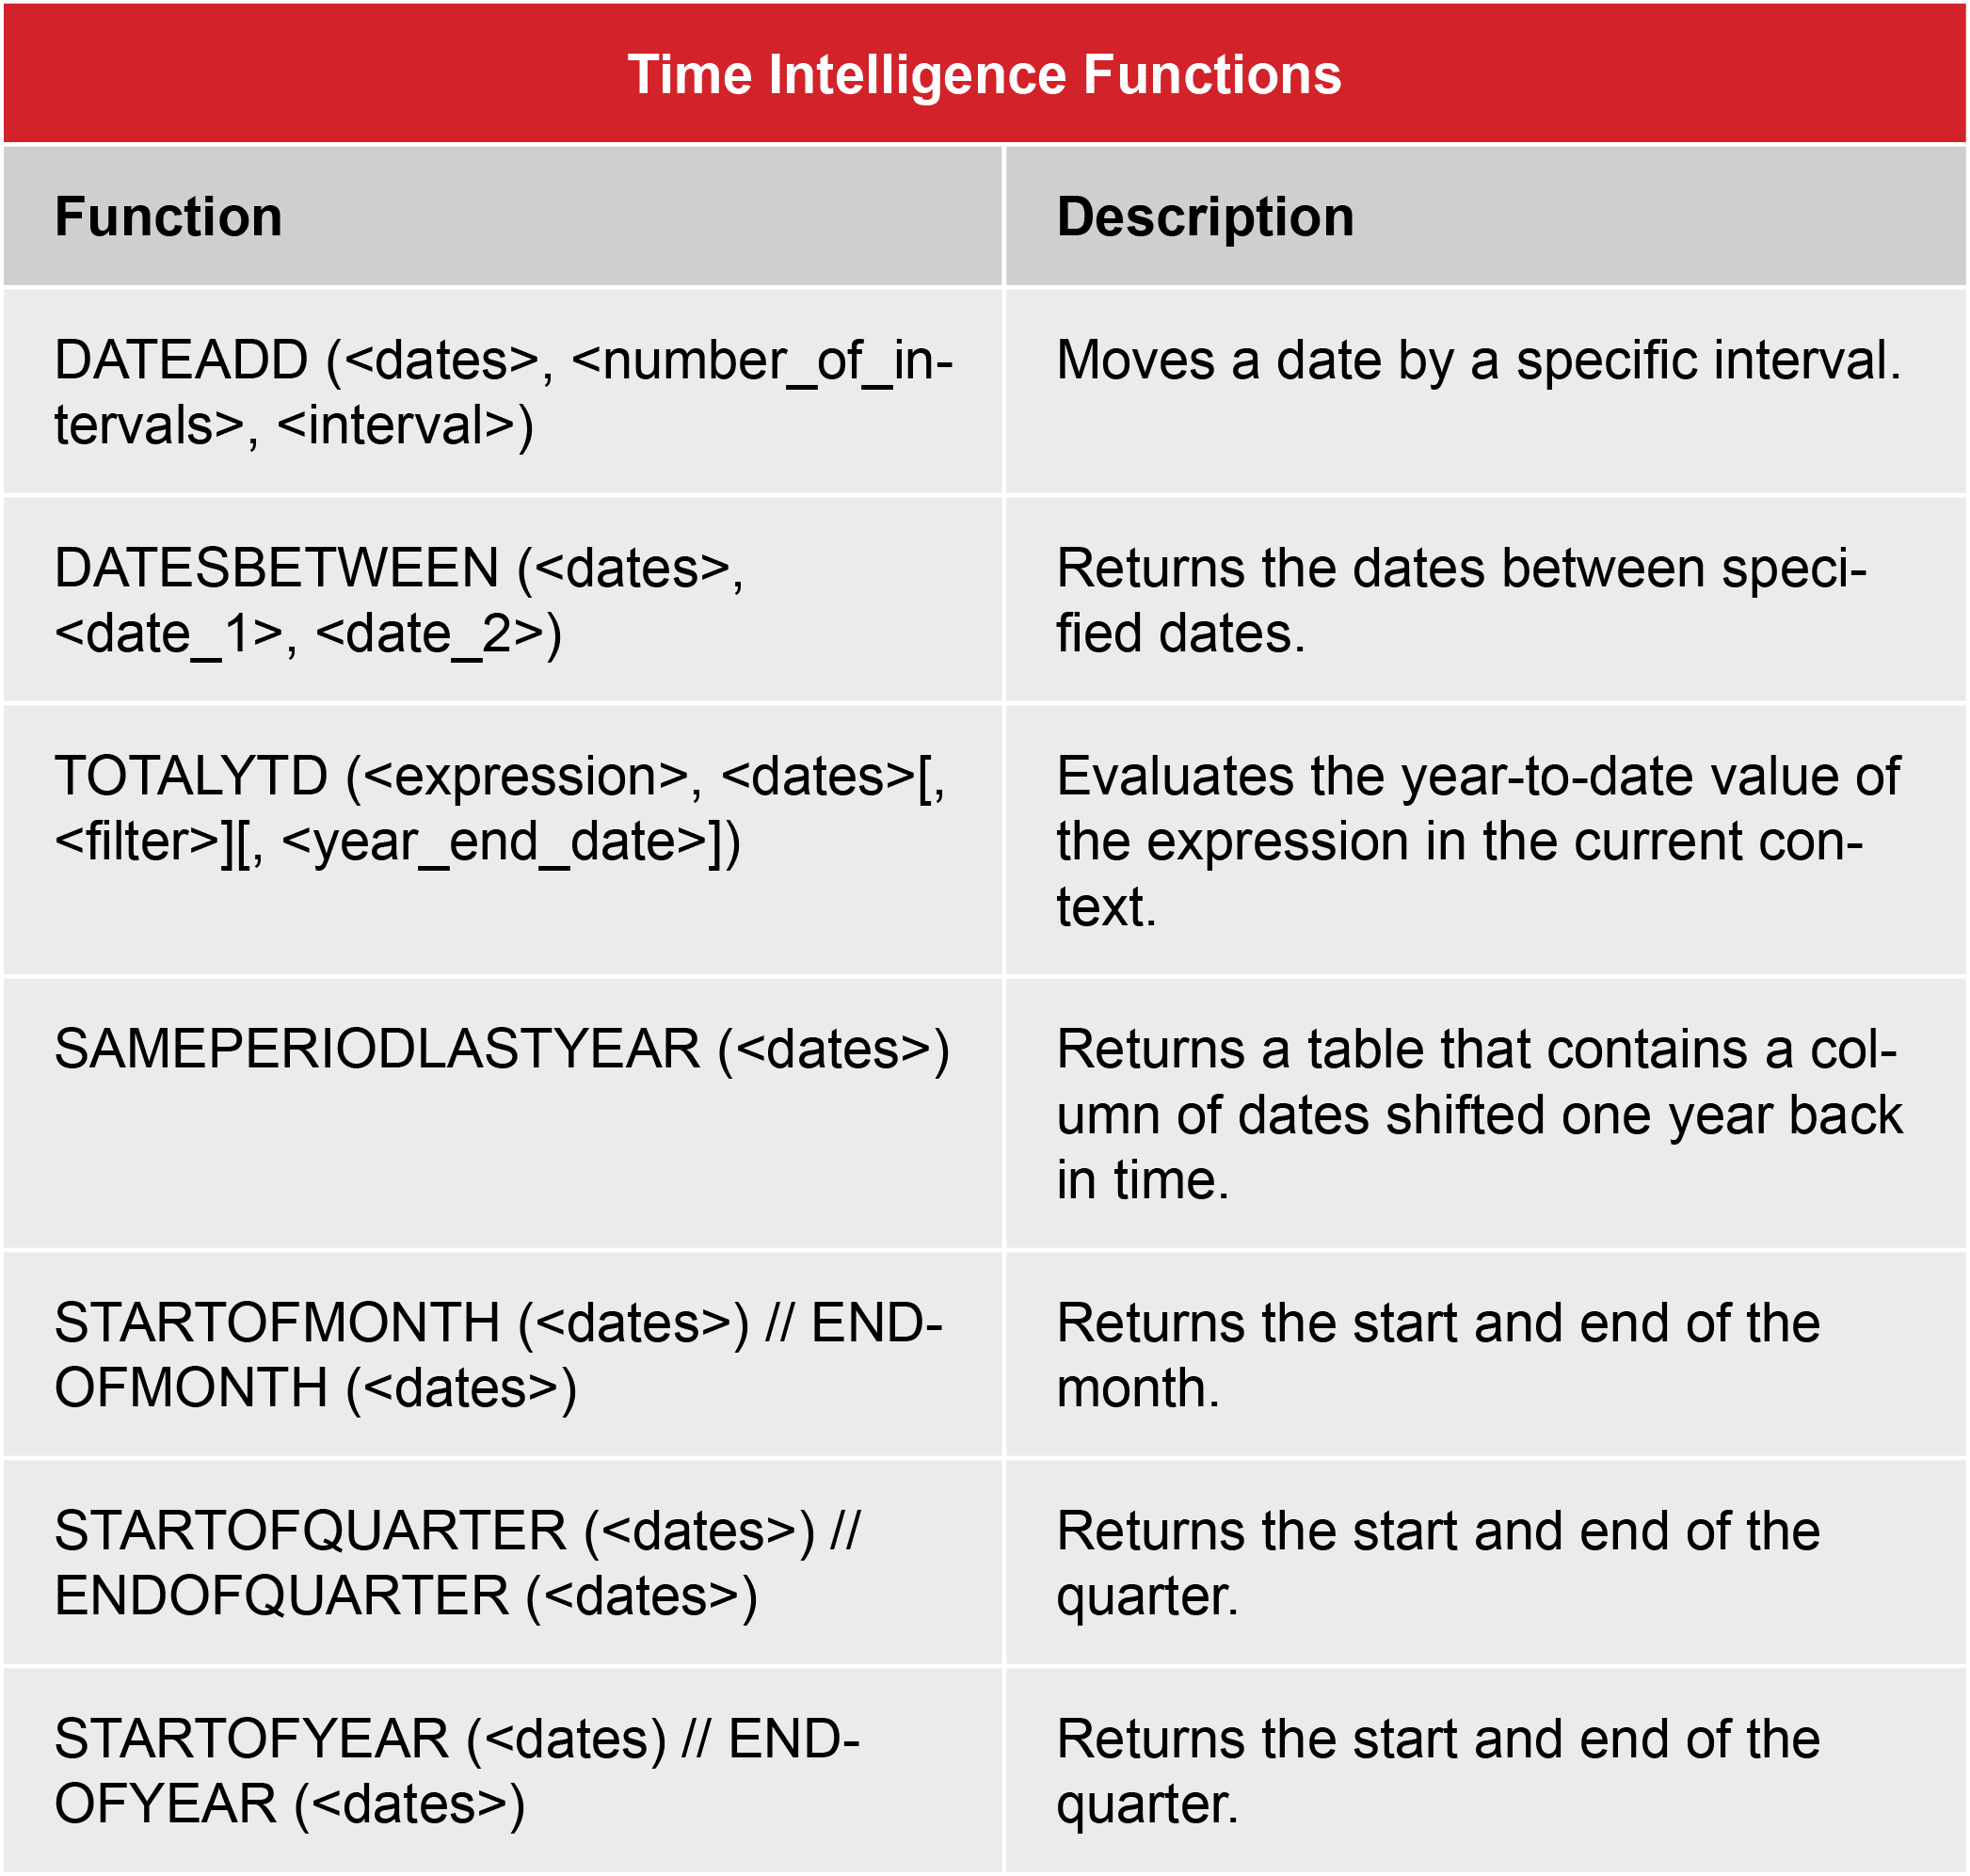
- The Time Intelligence Functions in DAX enable you to perform calculations using ranges of dates and compare results across parallel periods.
- DAX functions always reference a complete table or column – never a cell or range of cells.
Using DAX in Excel
You can use DAX functions to create custom calculations in Excel’s Power Pivot for calculated columns or calculated fields.
- Calculated columns – DAX formulas used in calculated columns always apply to every row in the column throughout the entire table. As a result, the value of the row might change depending on its context.
- Calculated fields—The results of the calculations heavily depend on the context, i.e., the Pivot Table design and the row and column headings affect the values used in calculations.
Using DAX in Power BI
DAX is designed to perform efficient data analysis and calculations. The following use cases are most common for DAX in Power BI:
- Dynamic calculations – The calculations are dynamically updated based on user interactions, slicers, or filters.
- Aggregations – DAX performs aggregations such as summing up filtered data sets, calculating running totals, or calculating YTD totals.
- Time intelligence calculations – DAX functions can be used to perform time-based calculations such as year-over-year growth, month-over-month comparisons, and other such aggregations.
- Contextual analysis – With DAX, you can perform calculations for specific categories, such as calculating averages for particular categories within a larger dataset.
- Defining hierarchies and drill-downs – DAX functions can be used to define custom hierarchies for drill-down exploration.
- Calculating KPIs (Key Performance Indicators) – One of the most common uses of DAX is calculating KPIs specific to each business and its needs.
Traditional Excel Functions vs DAX
Now that we know how to use DAX functions in Excel and Power BI let’s examine how they differ from traditional Excel functions to get an even better picture of what they can do.

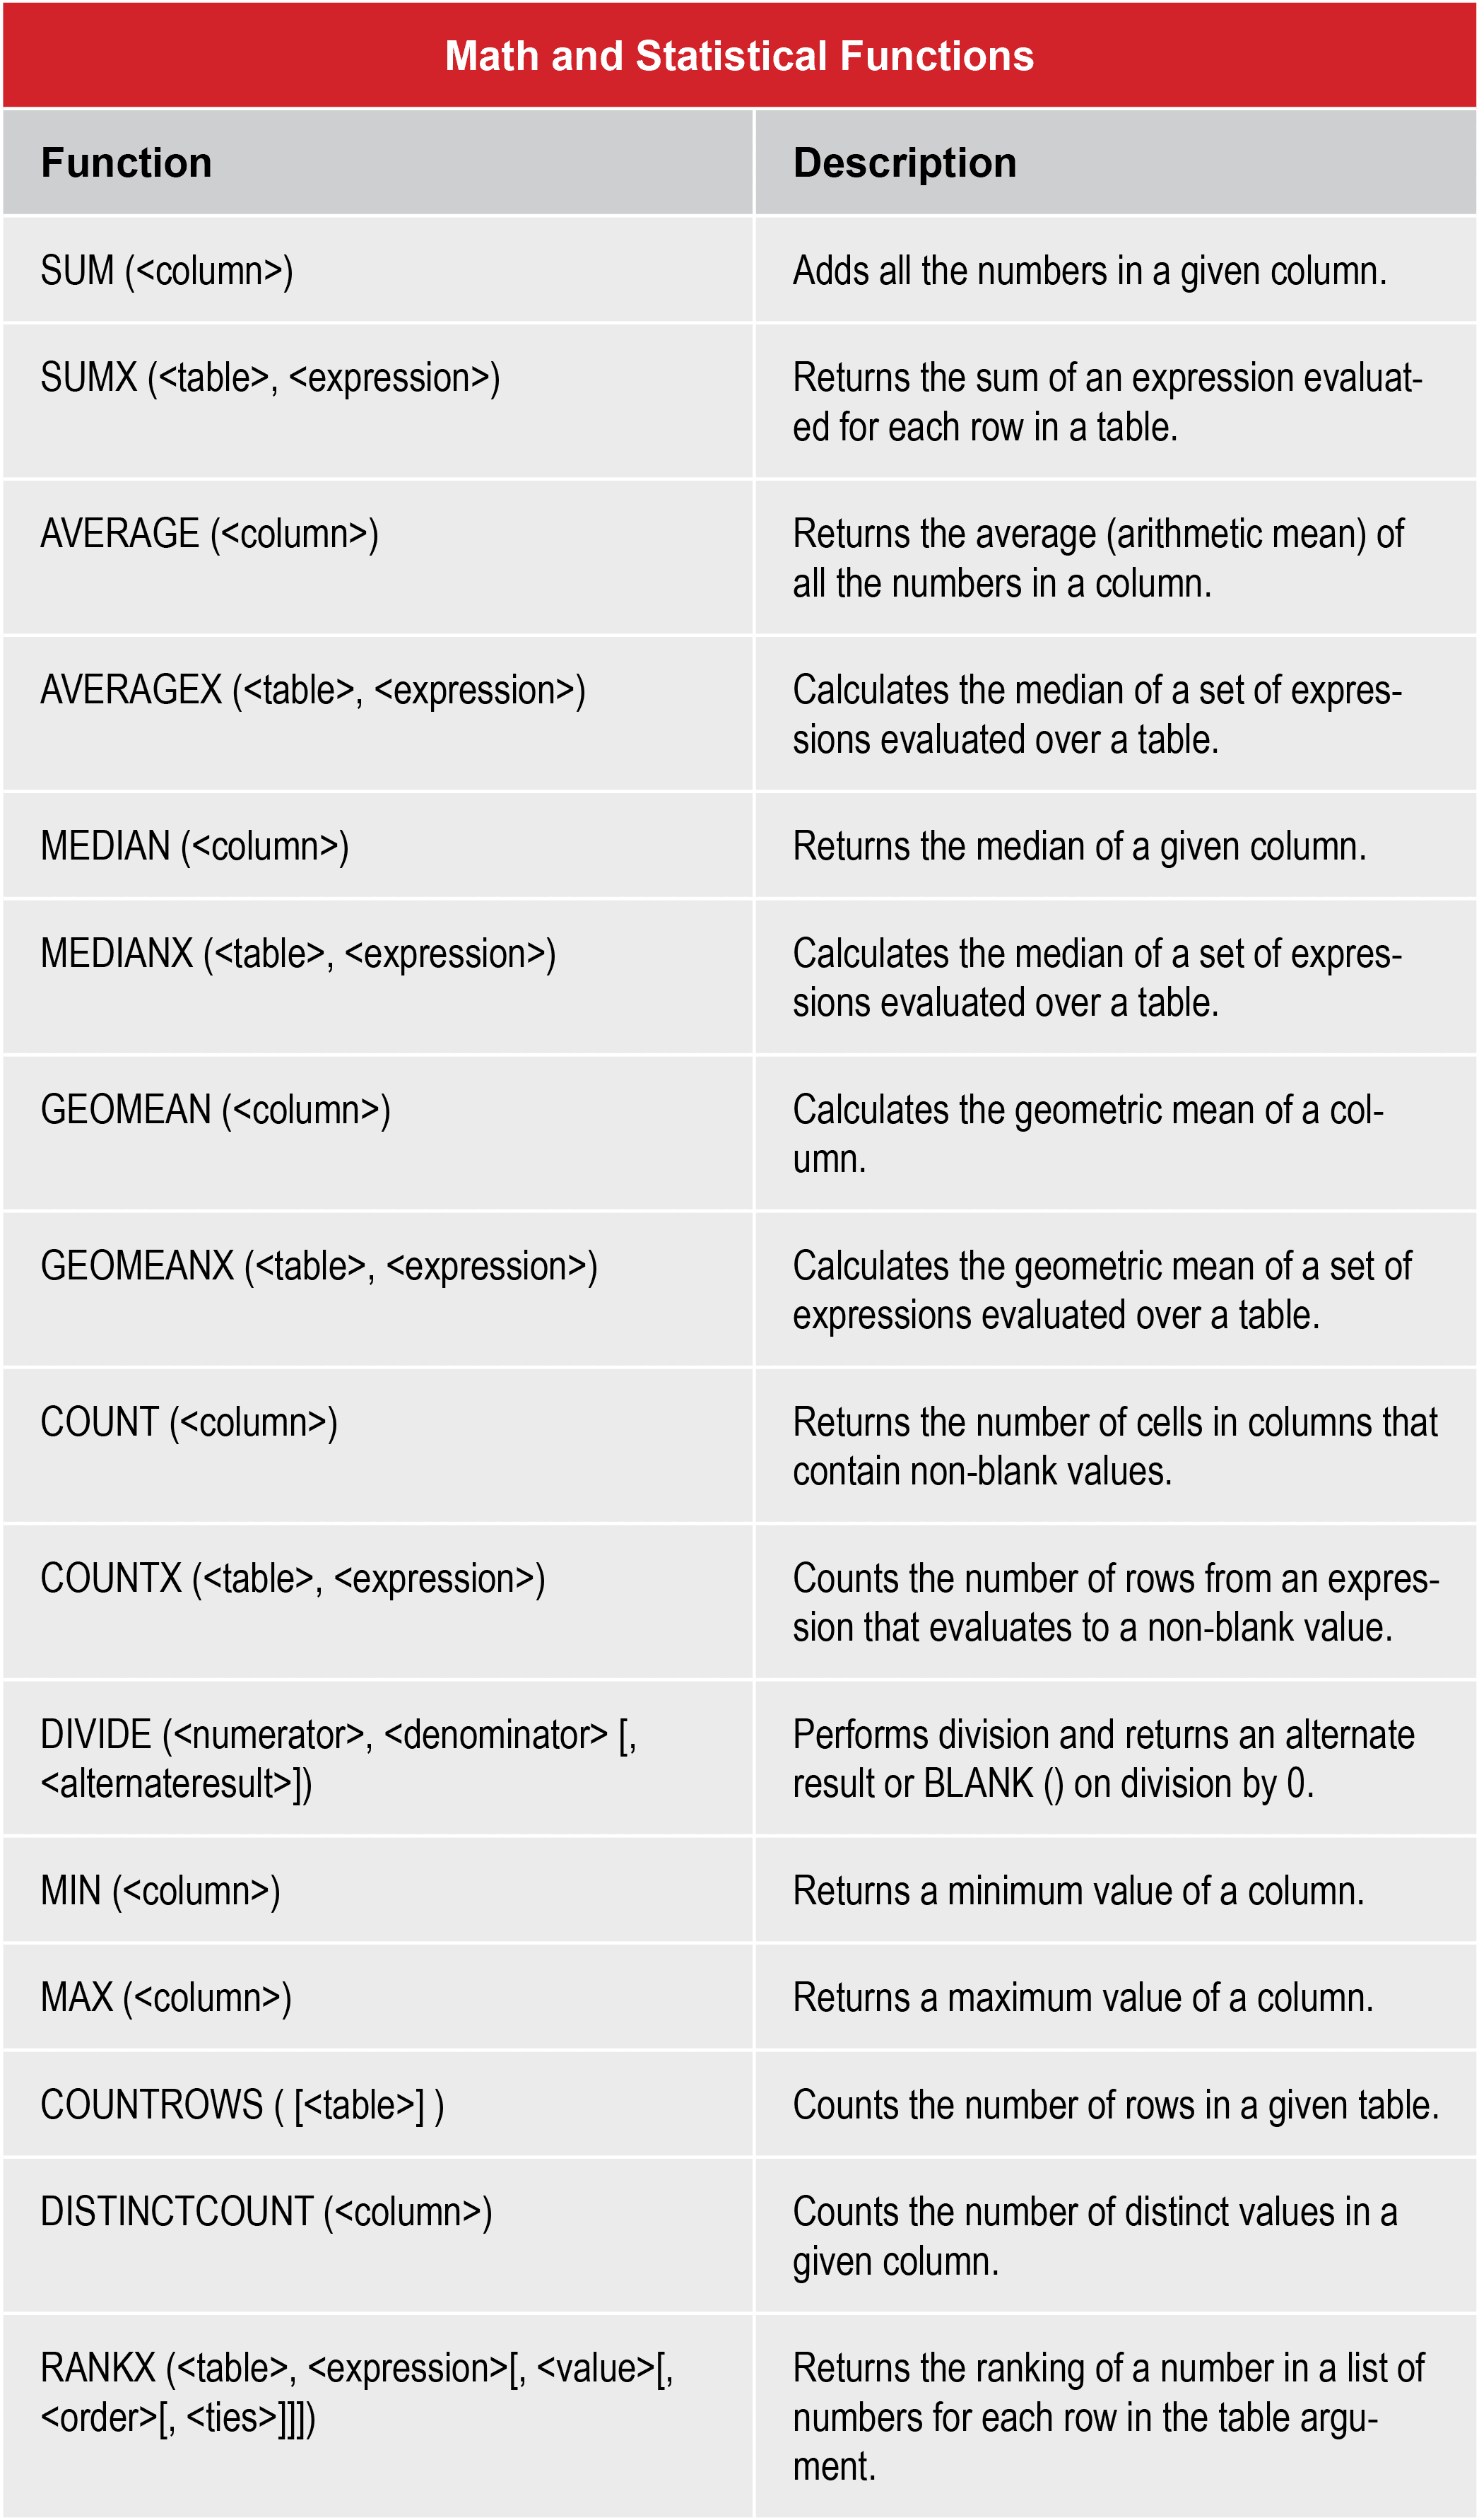
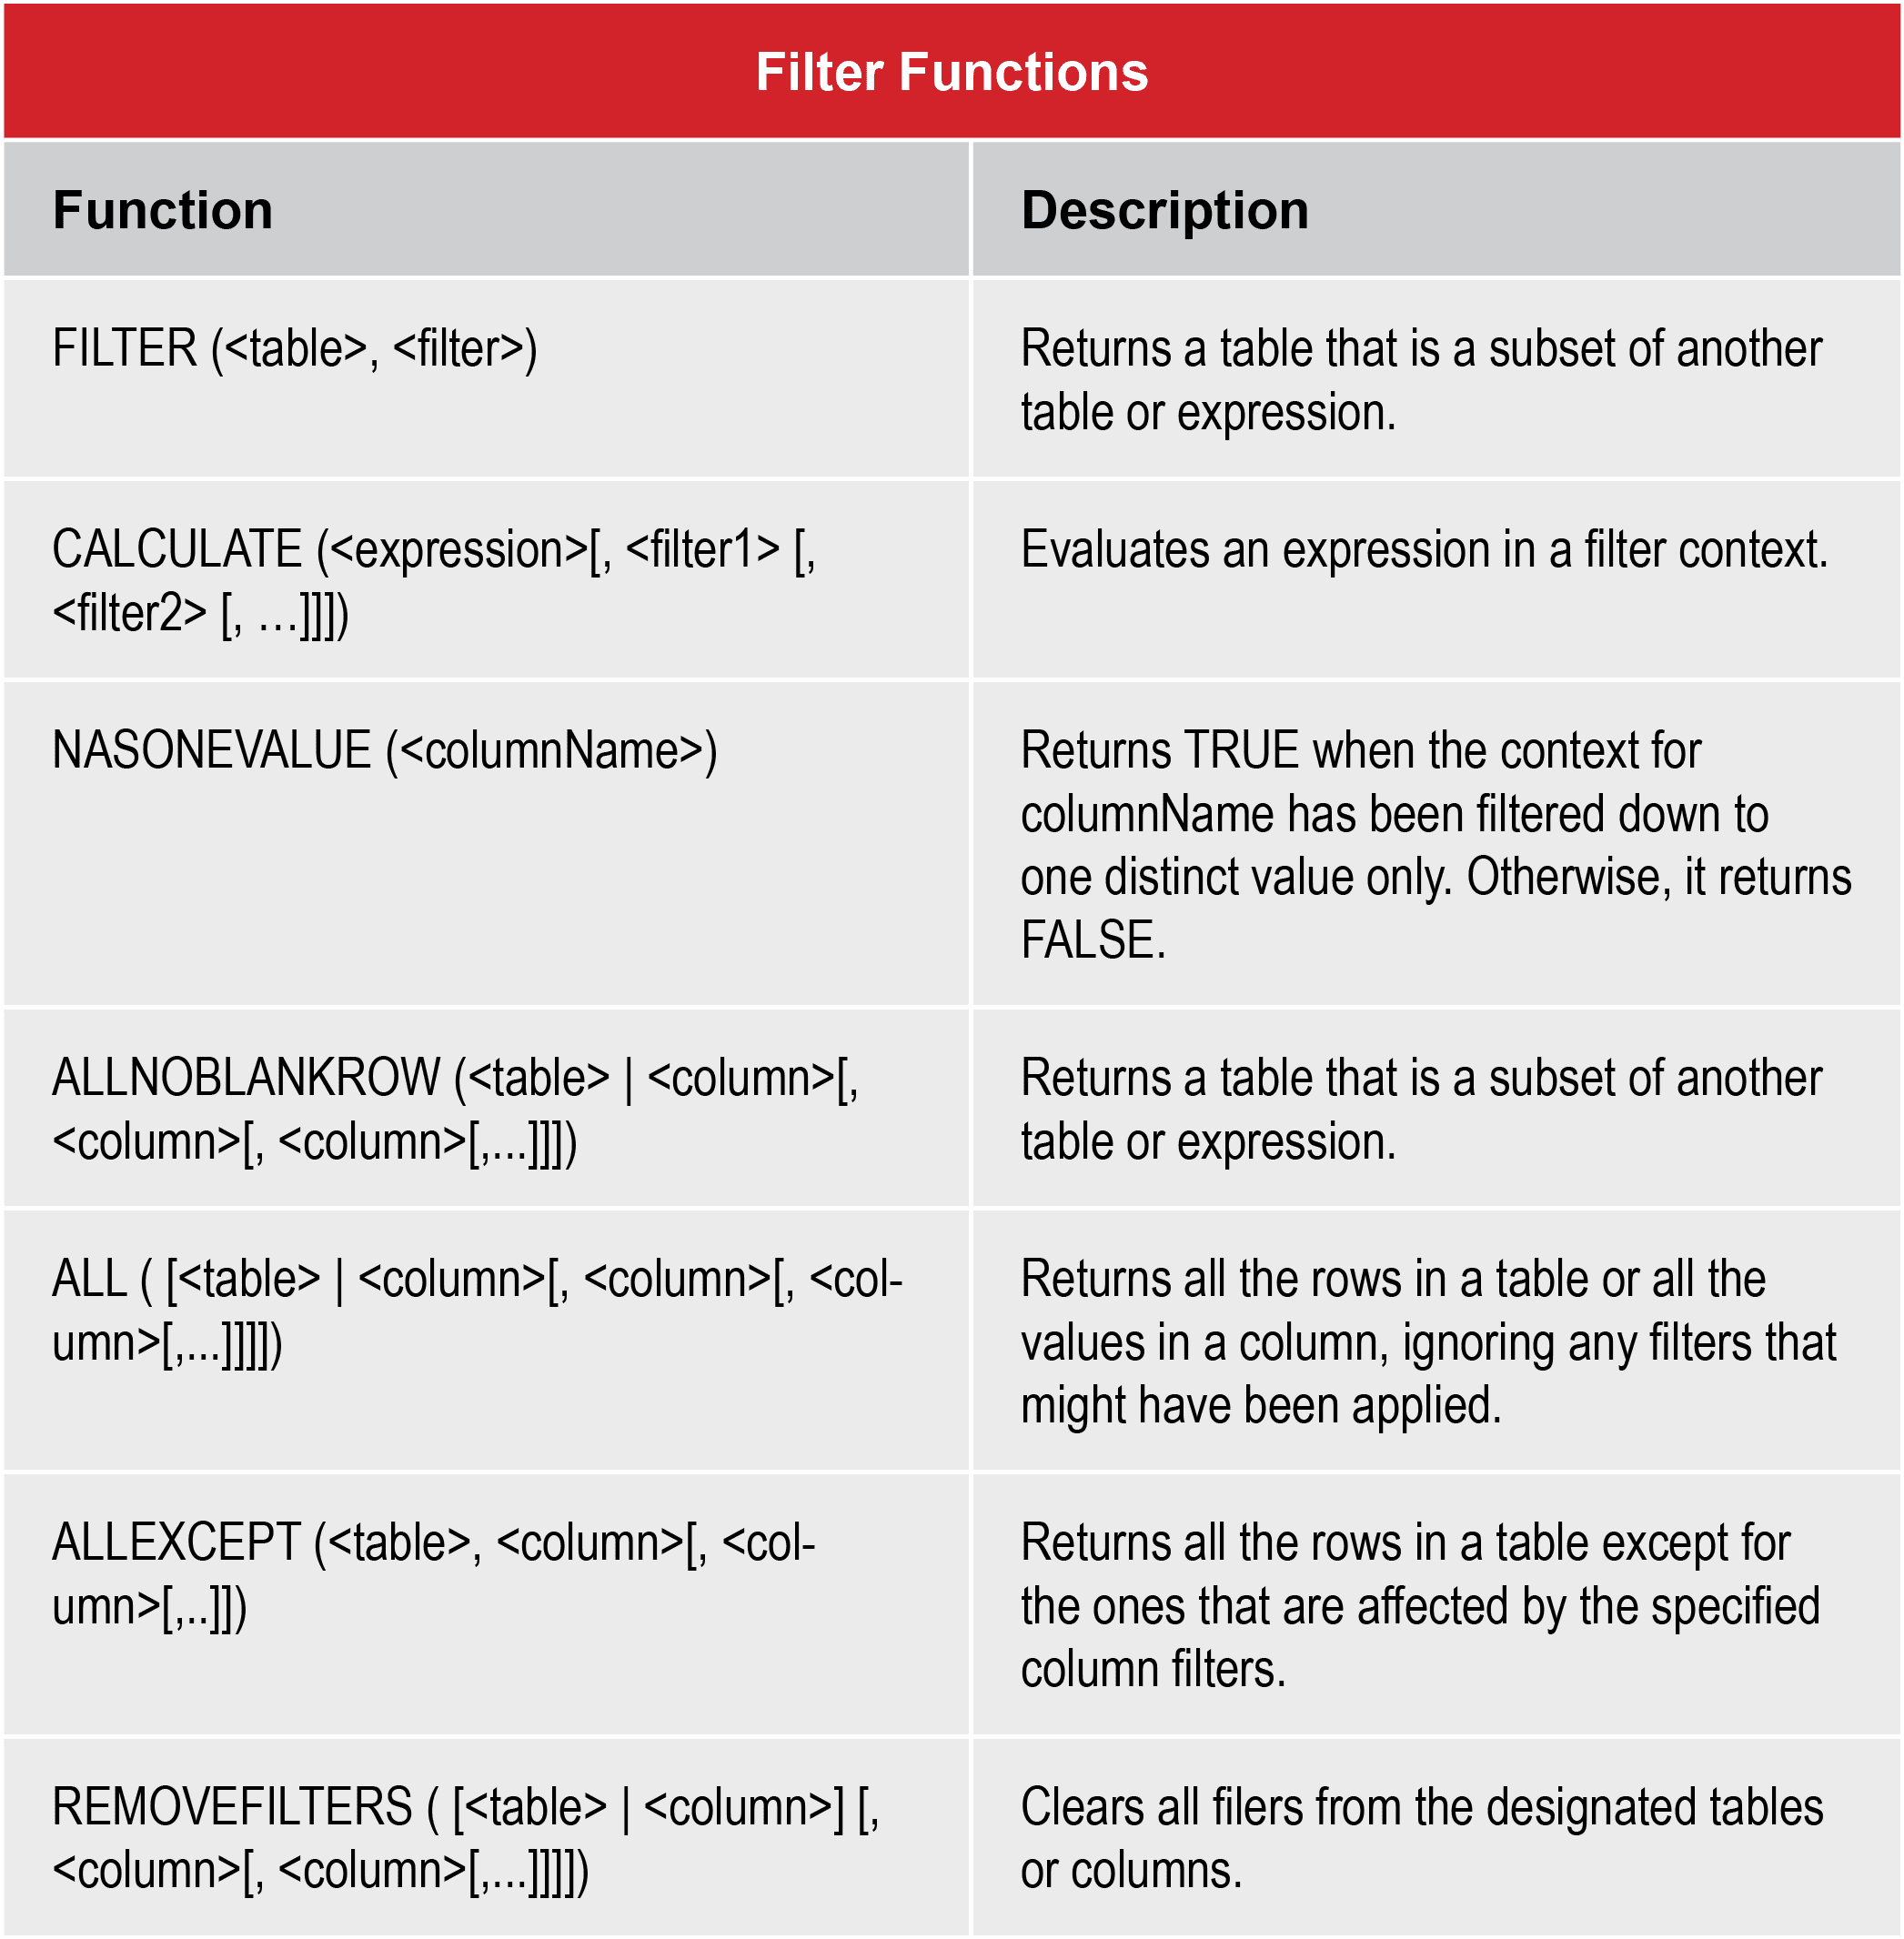
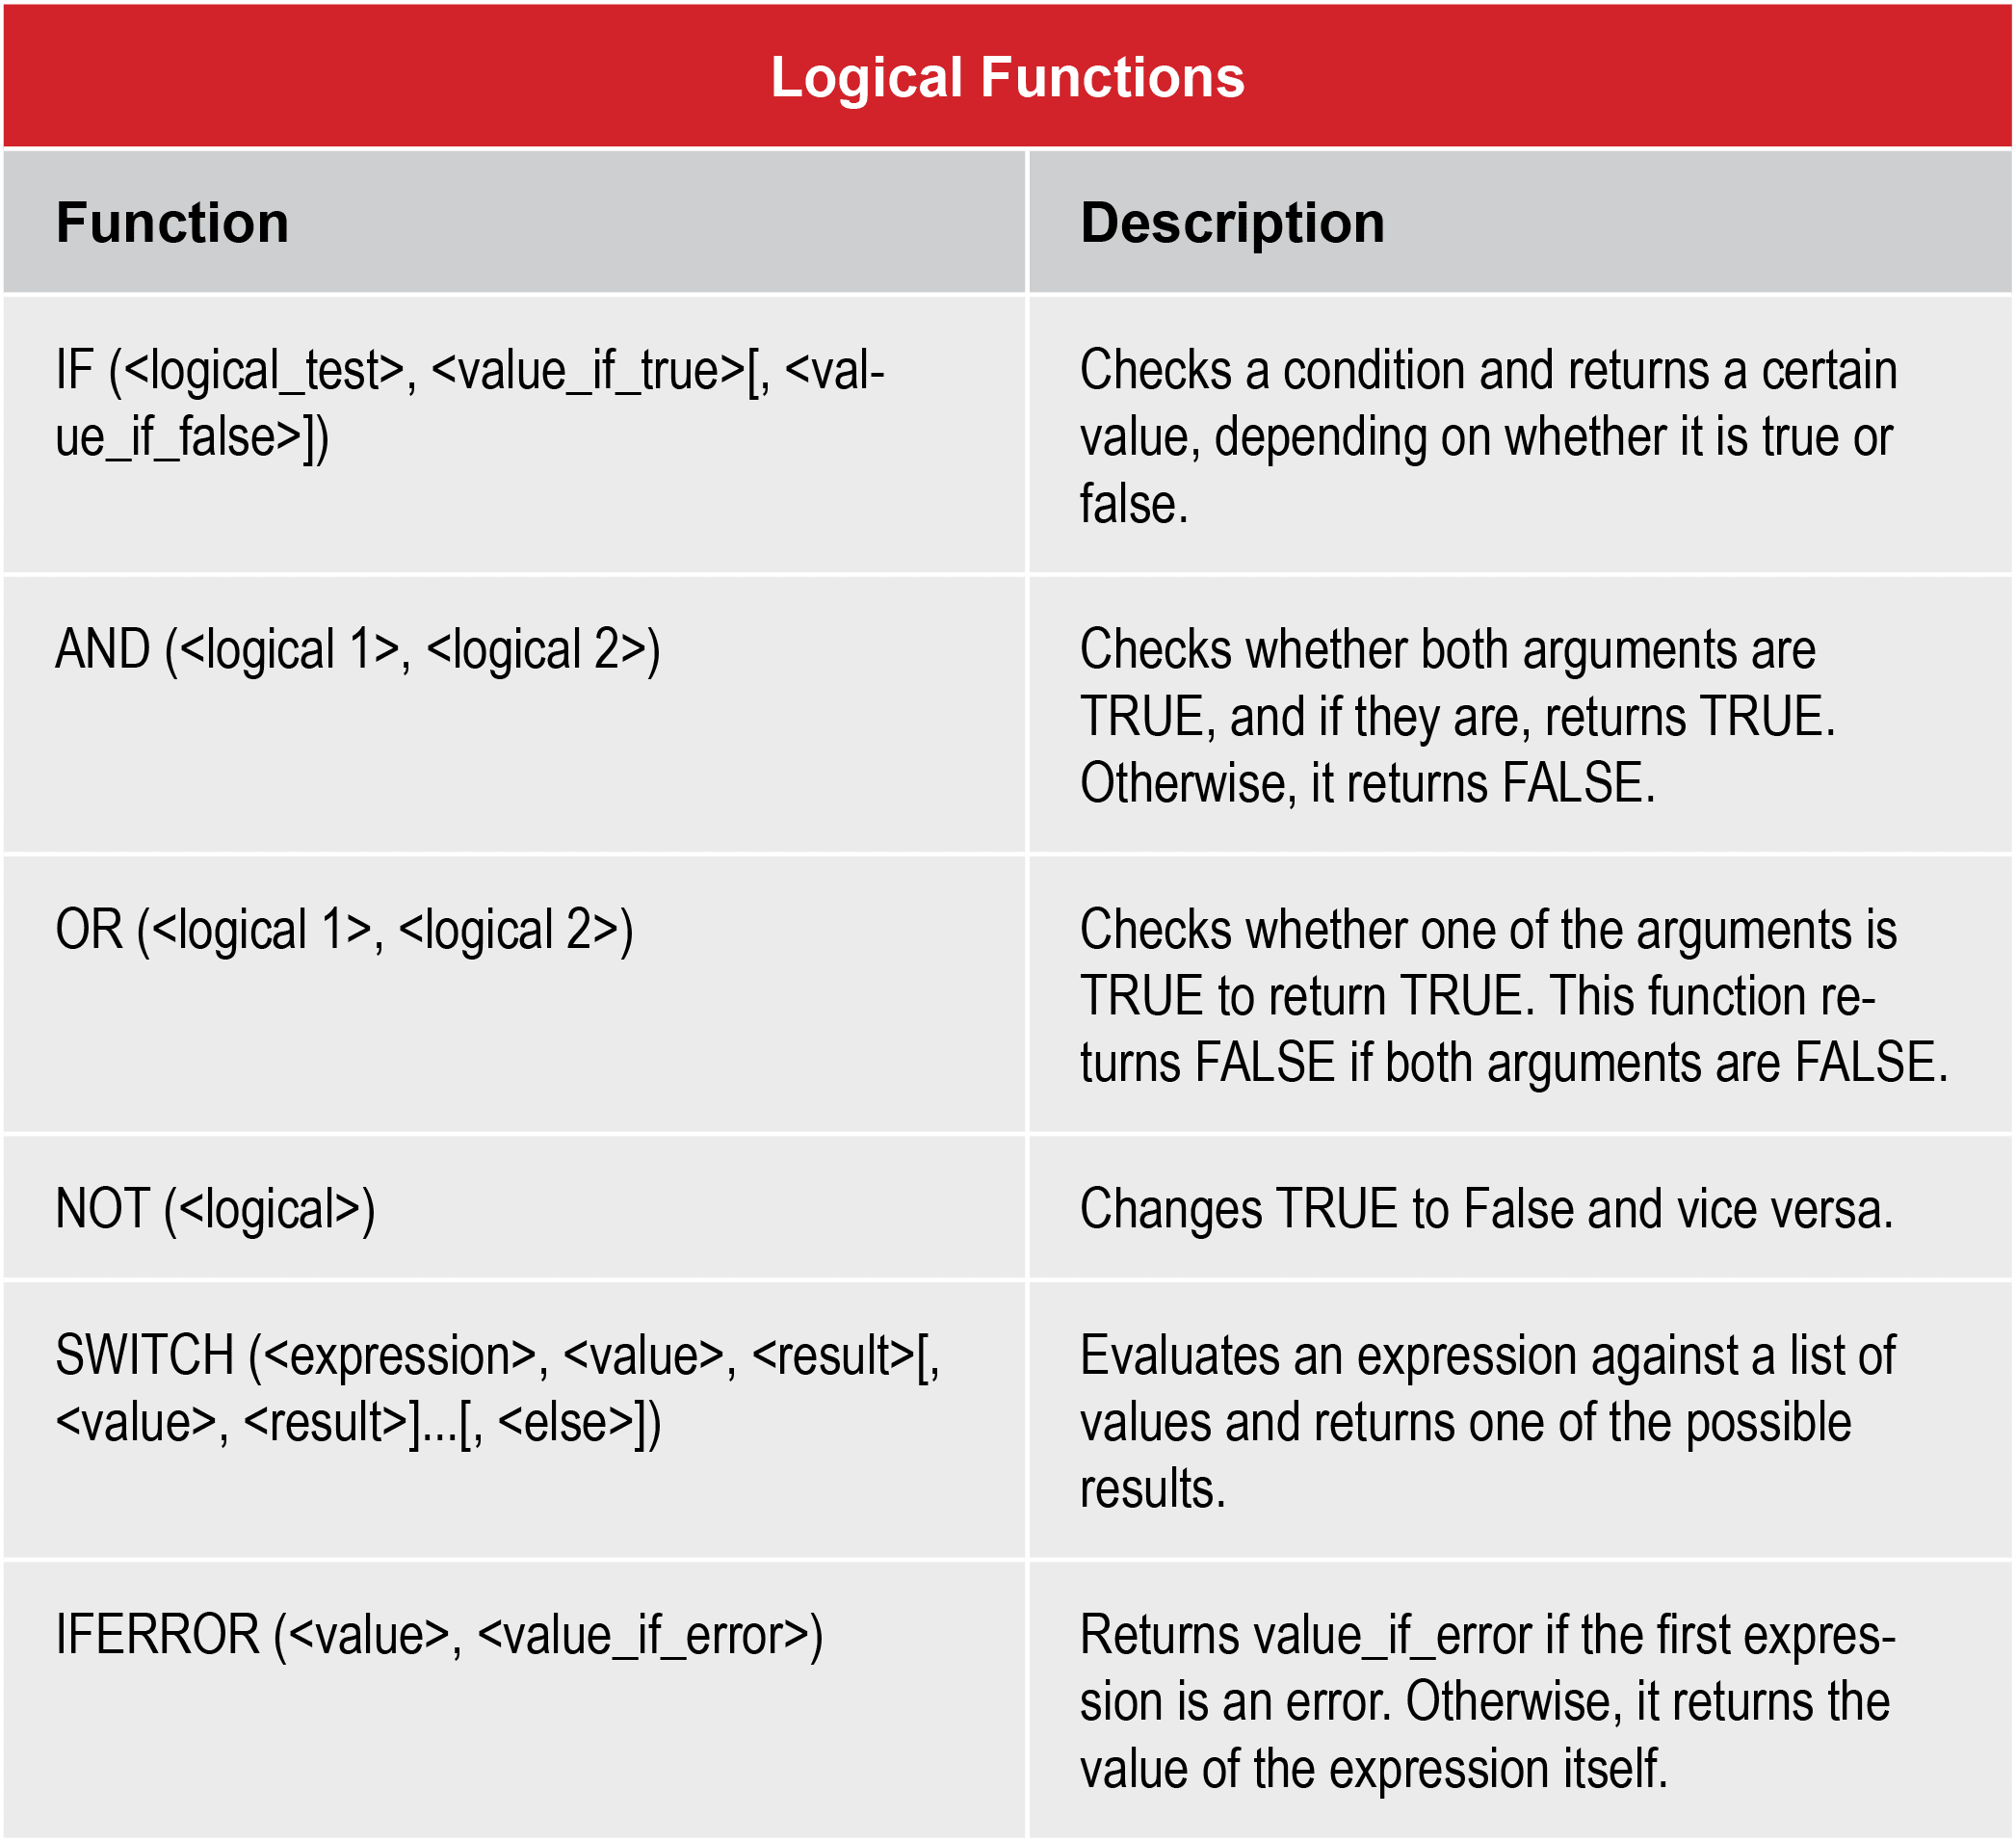
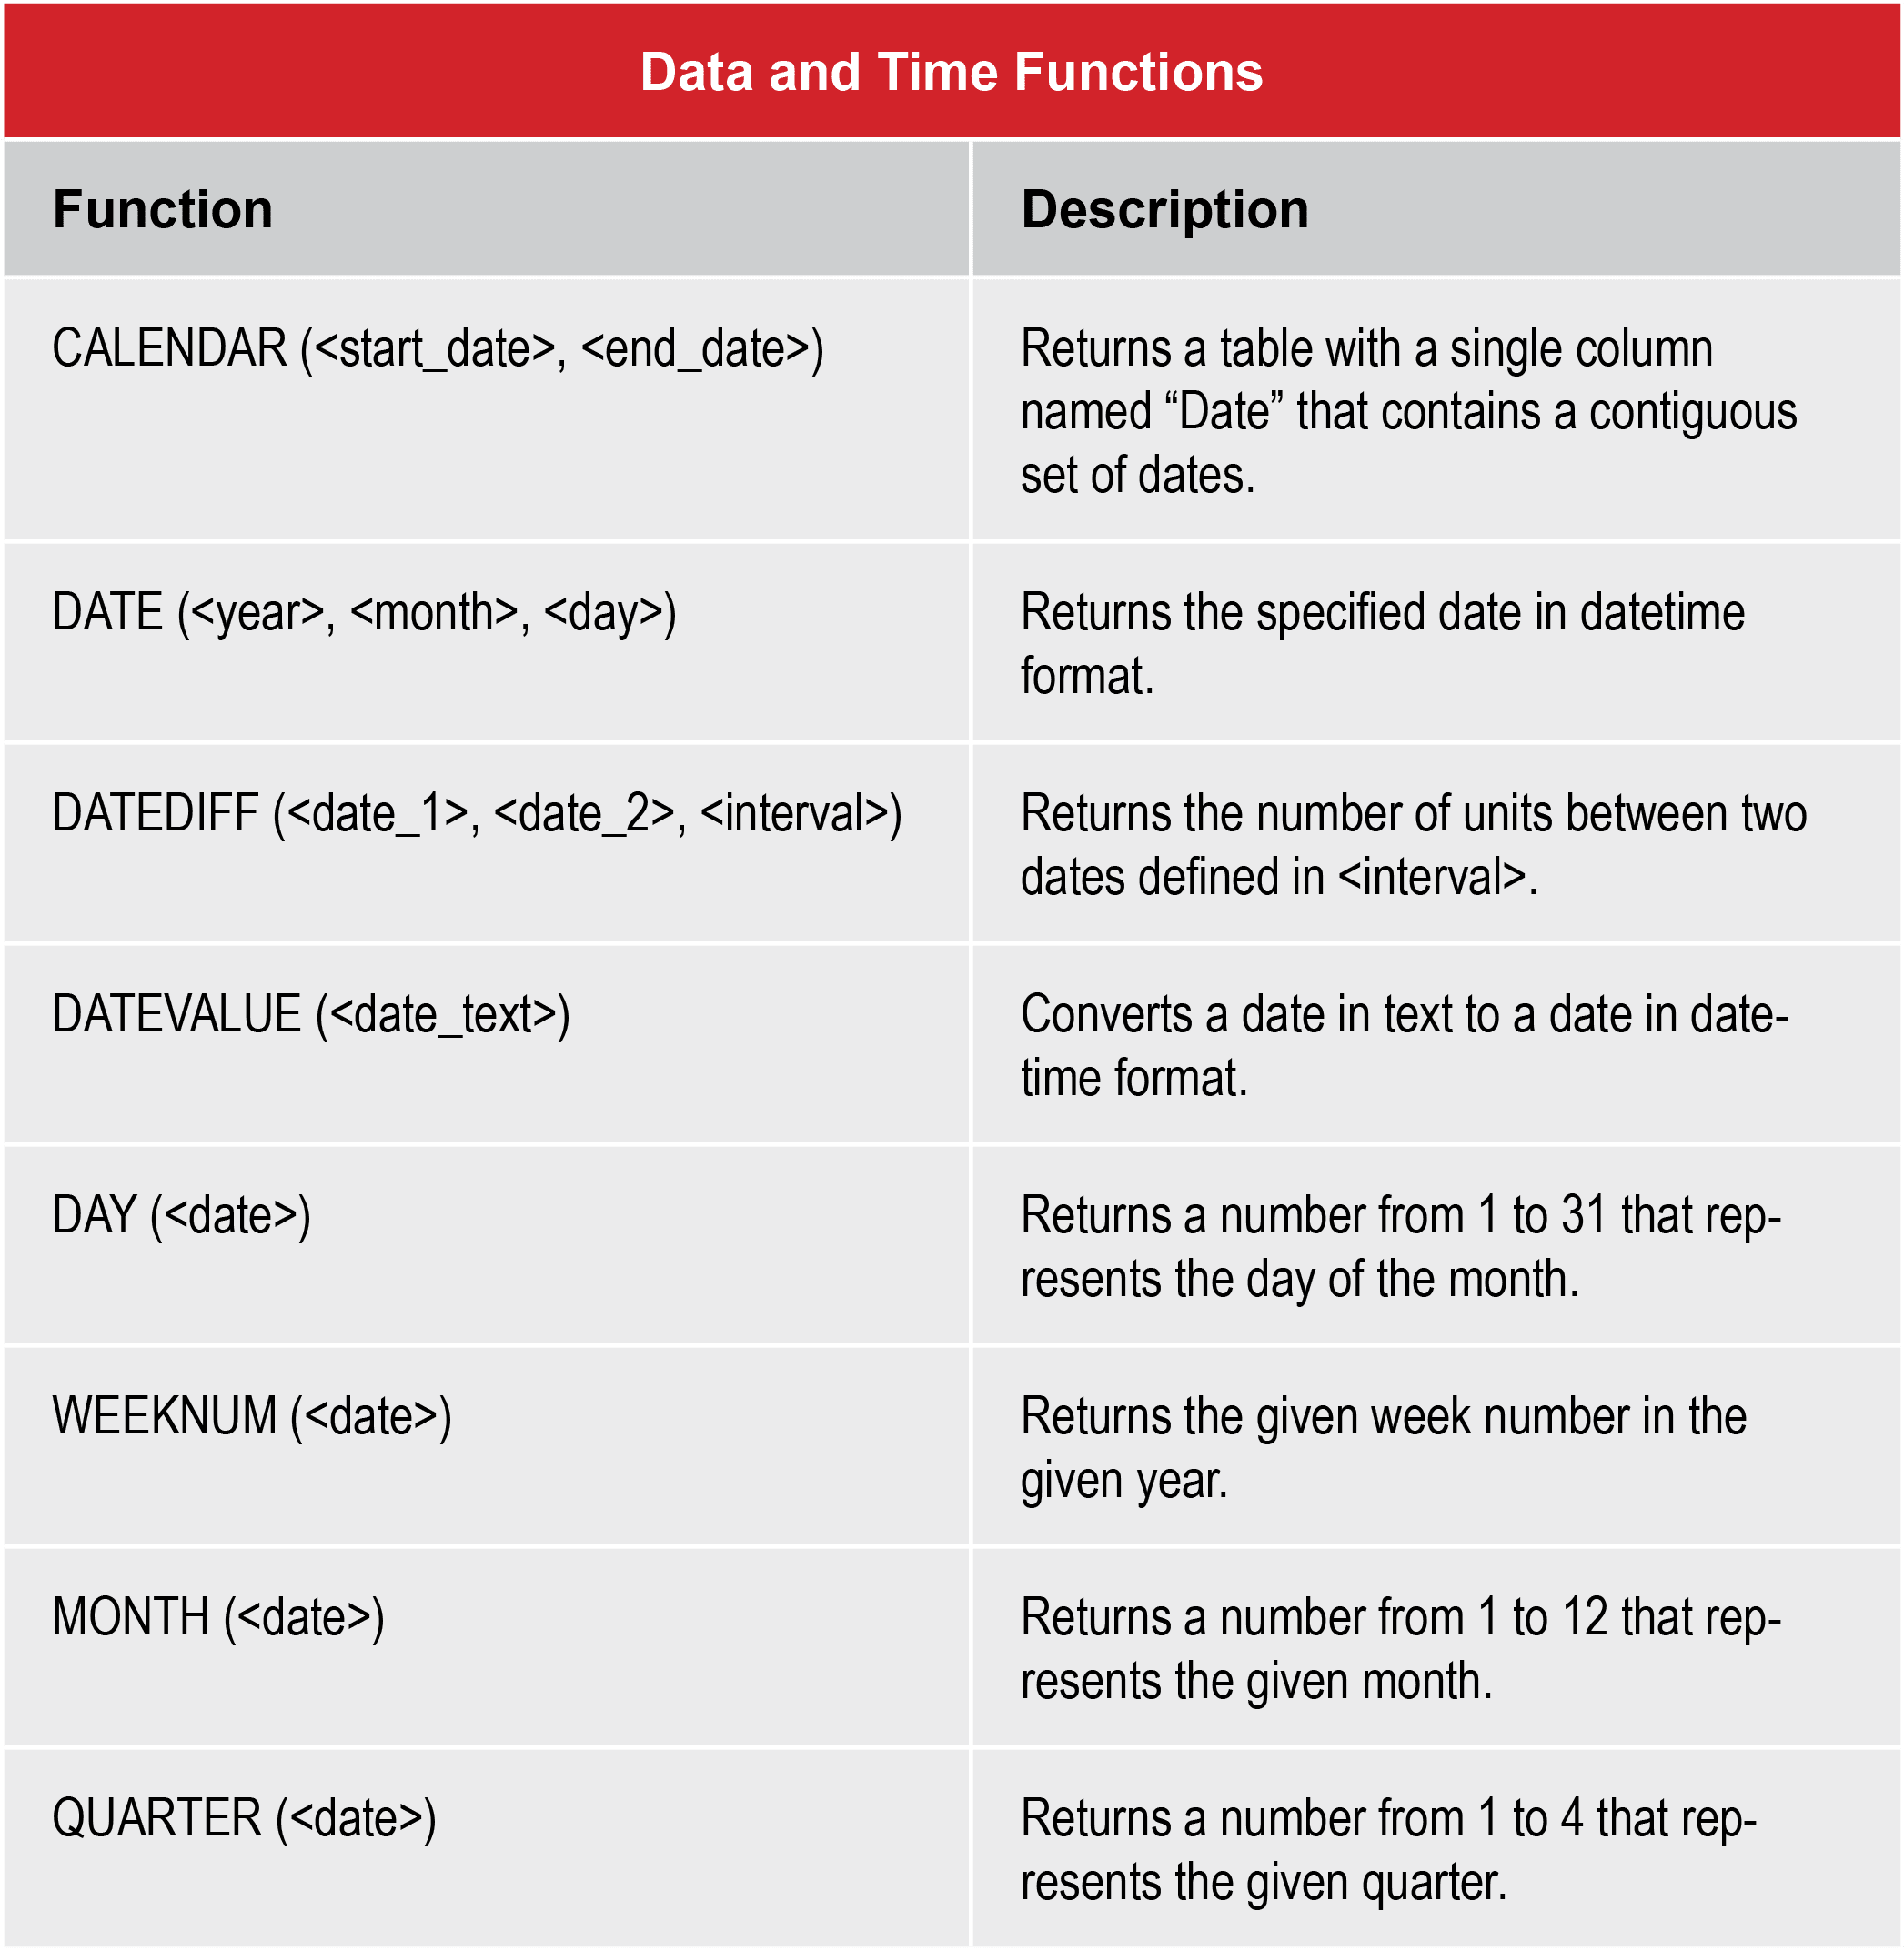
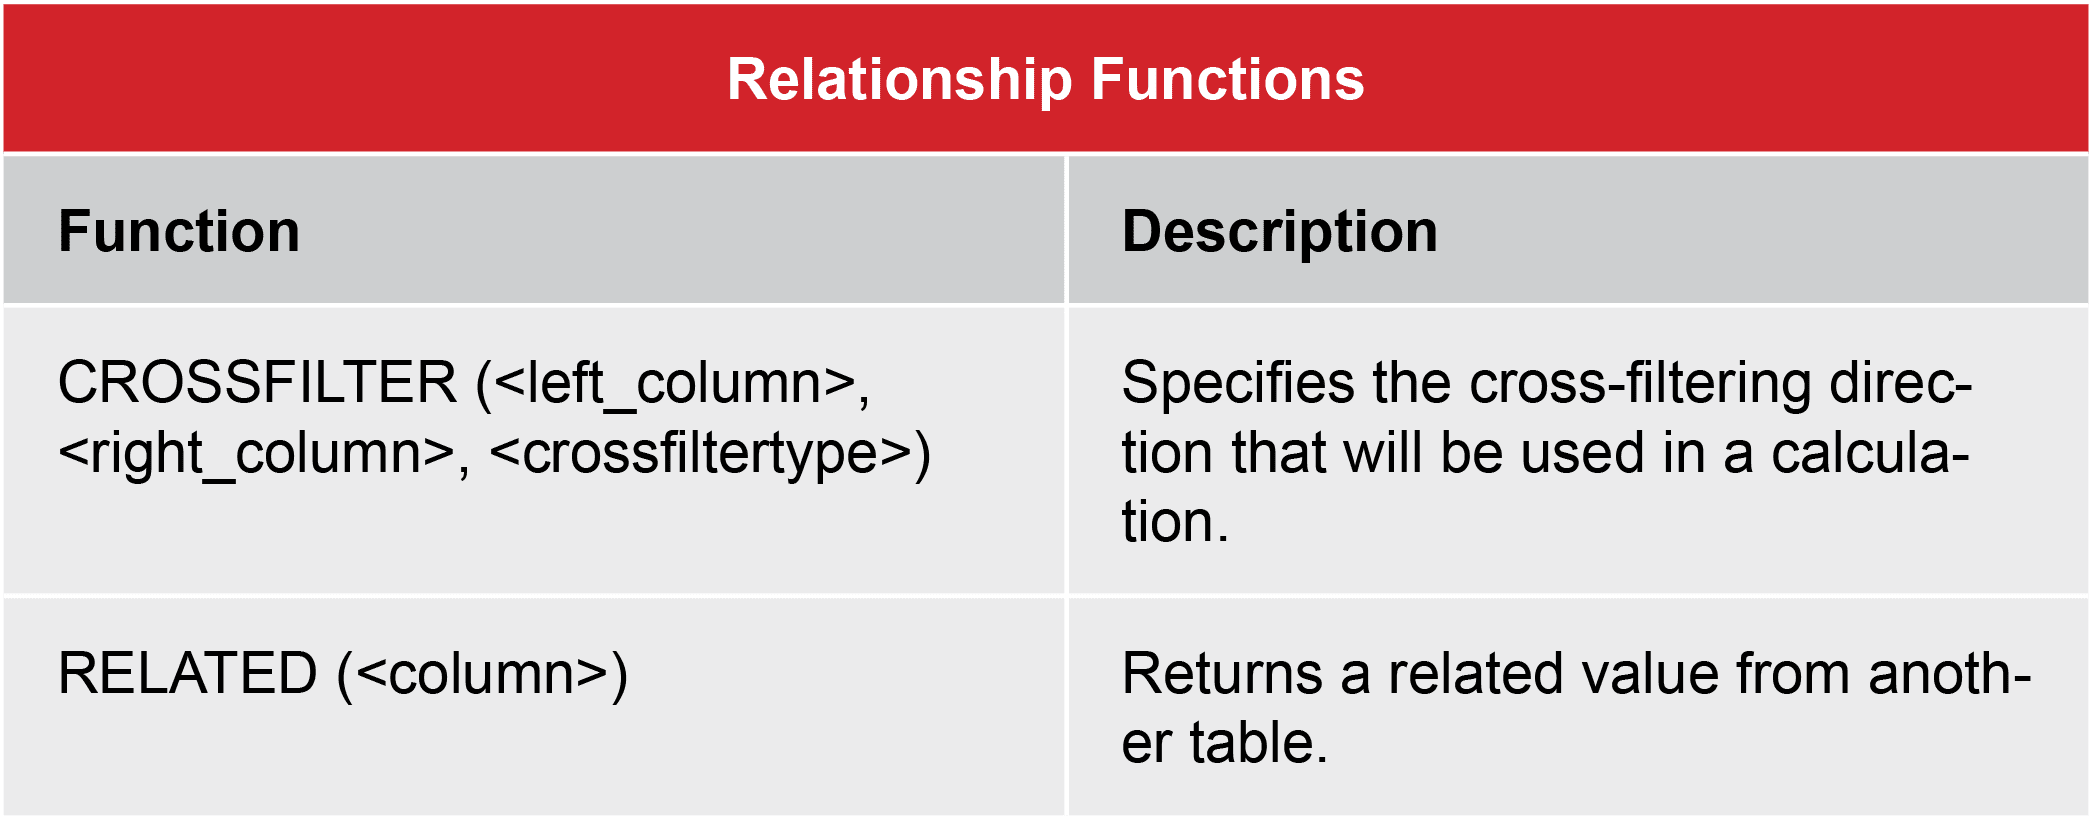
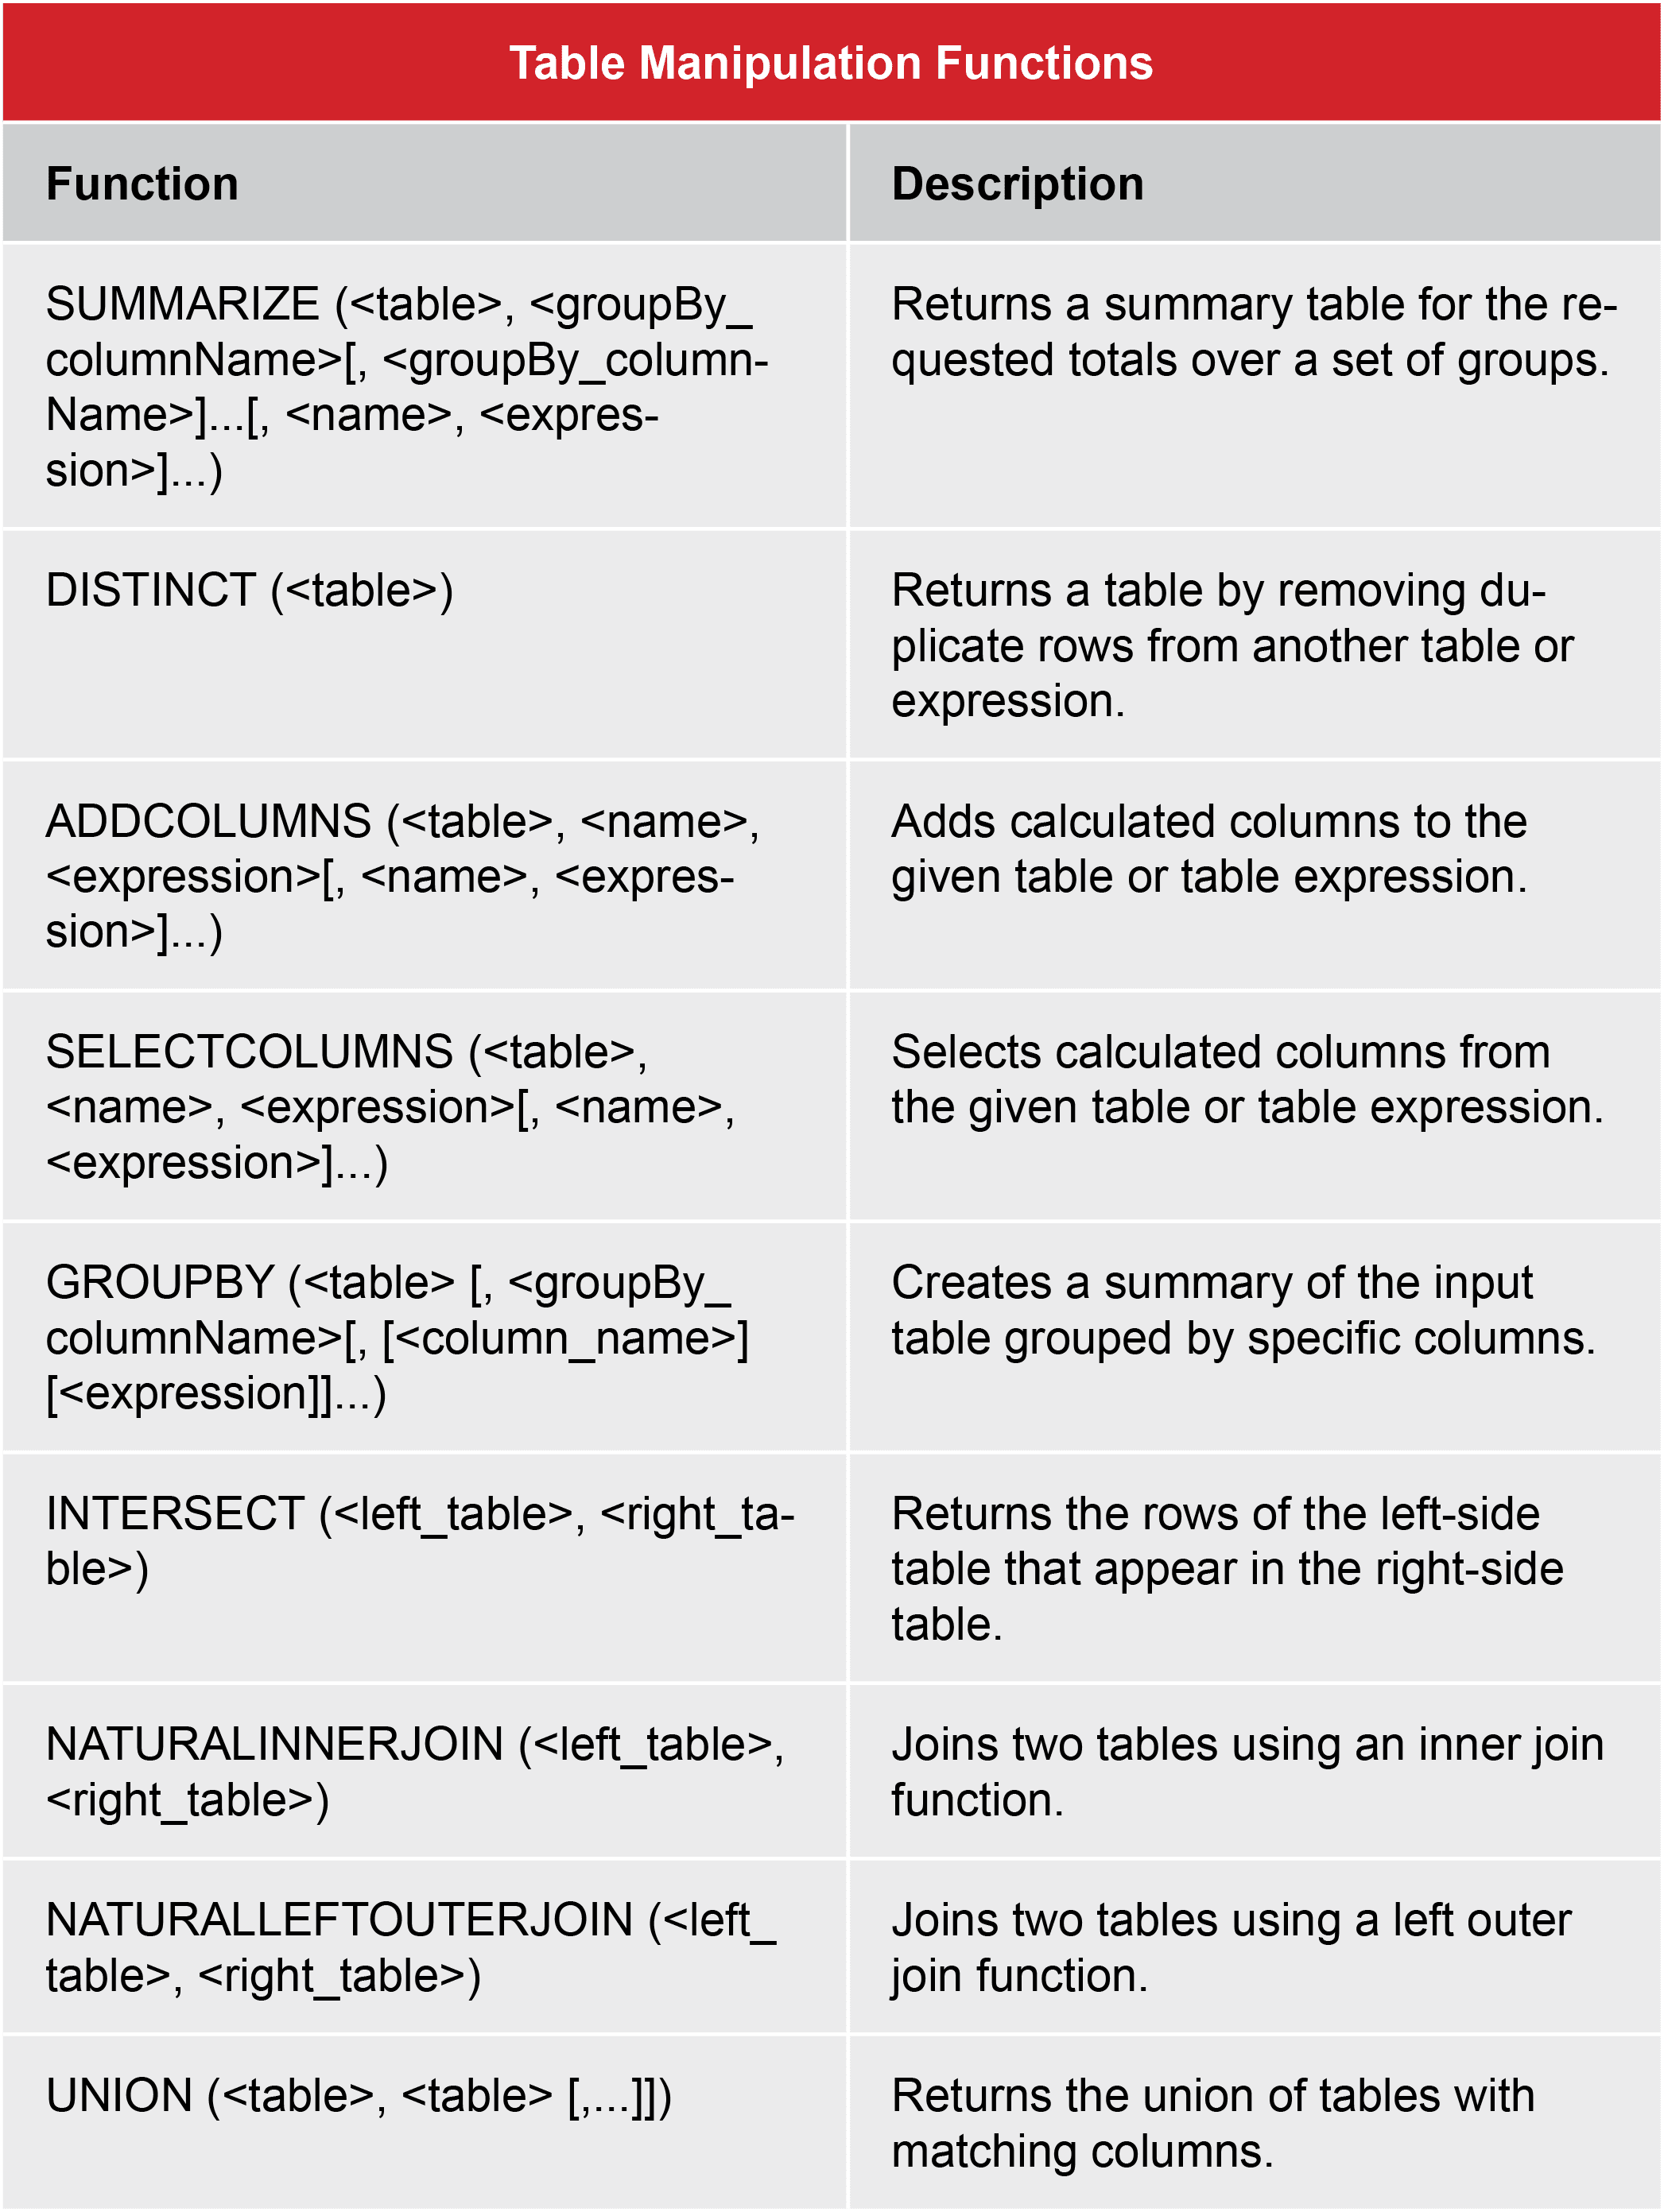
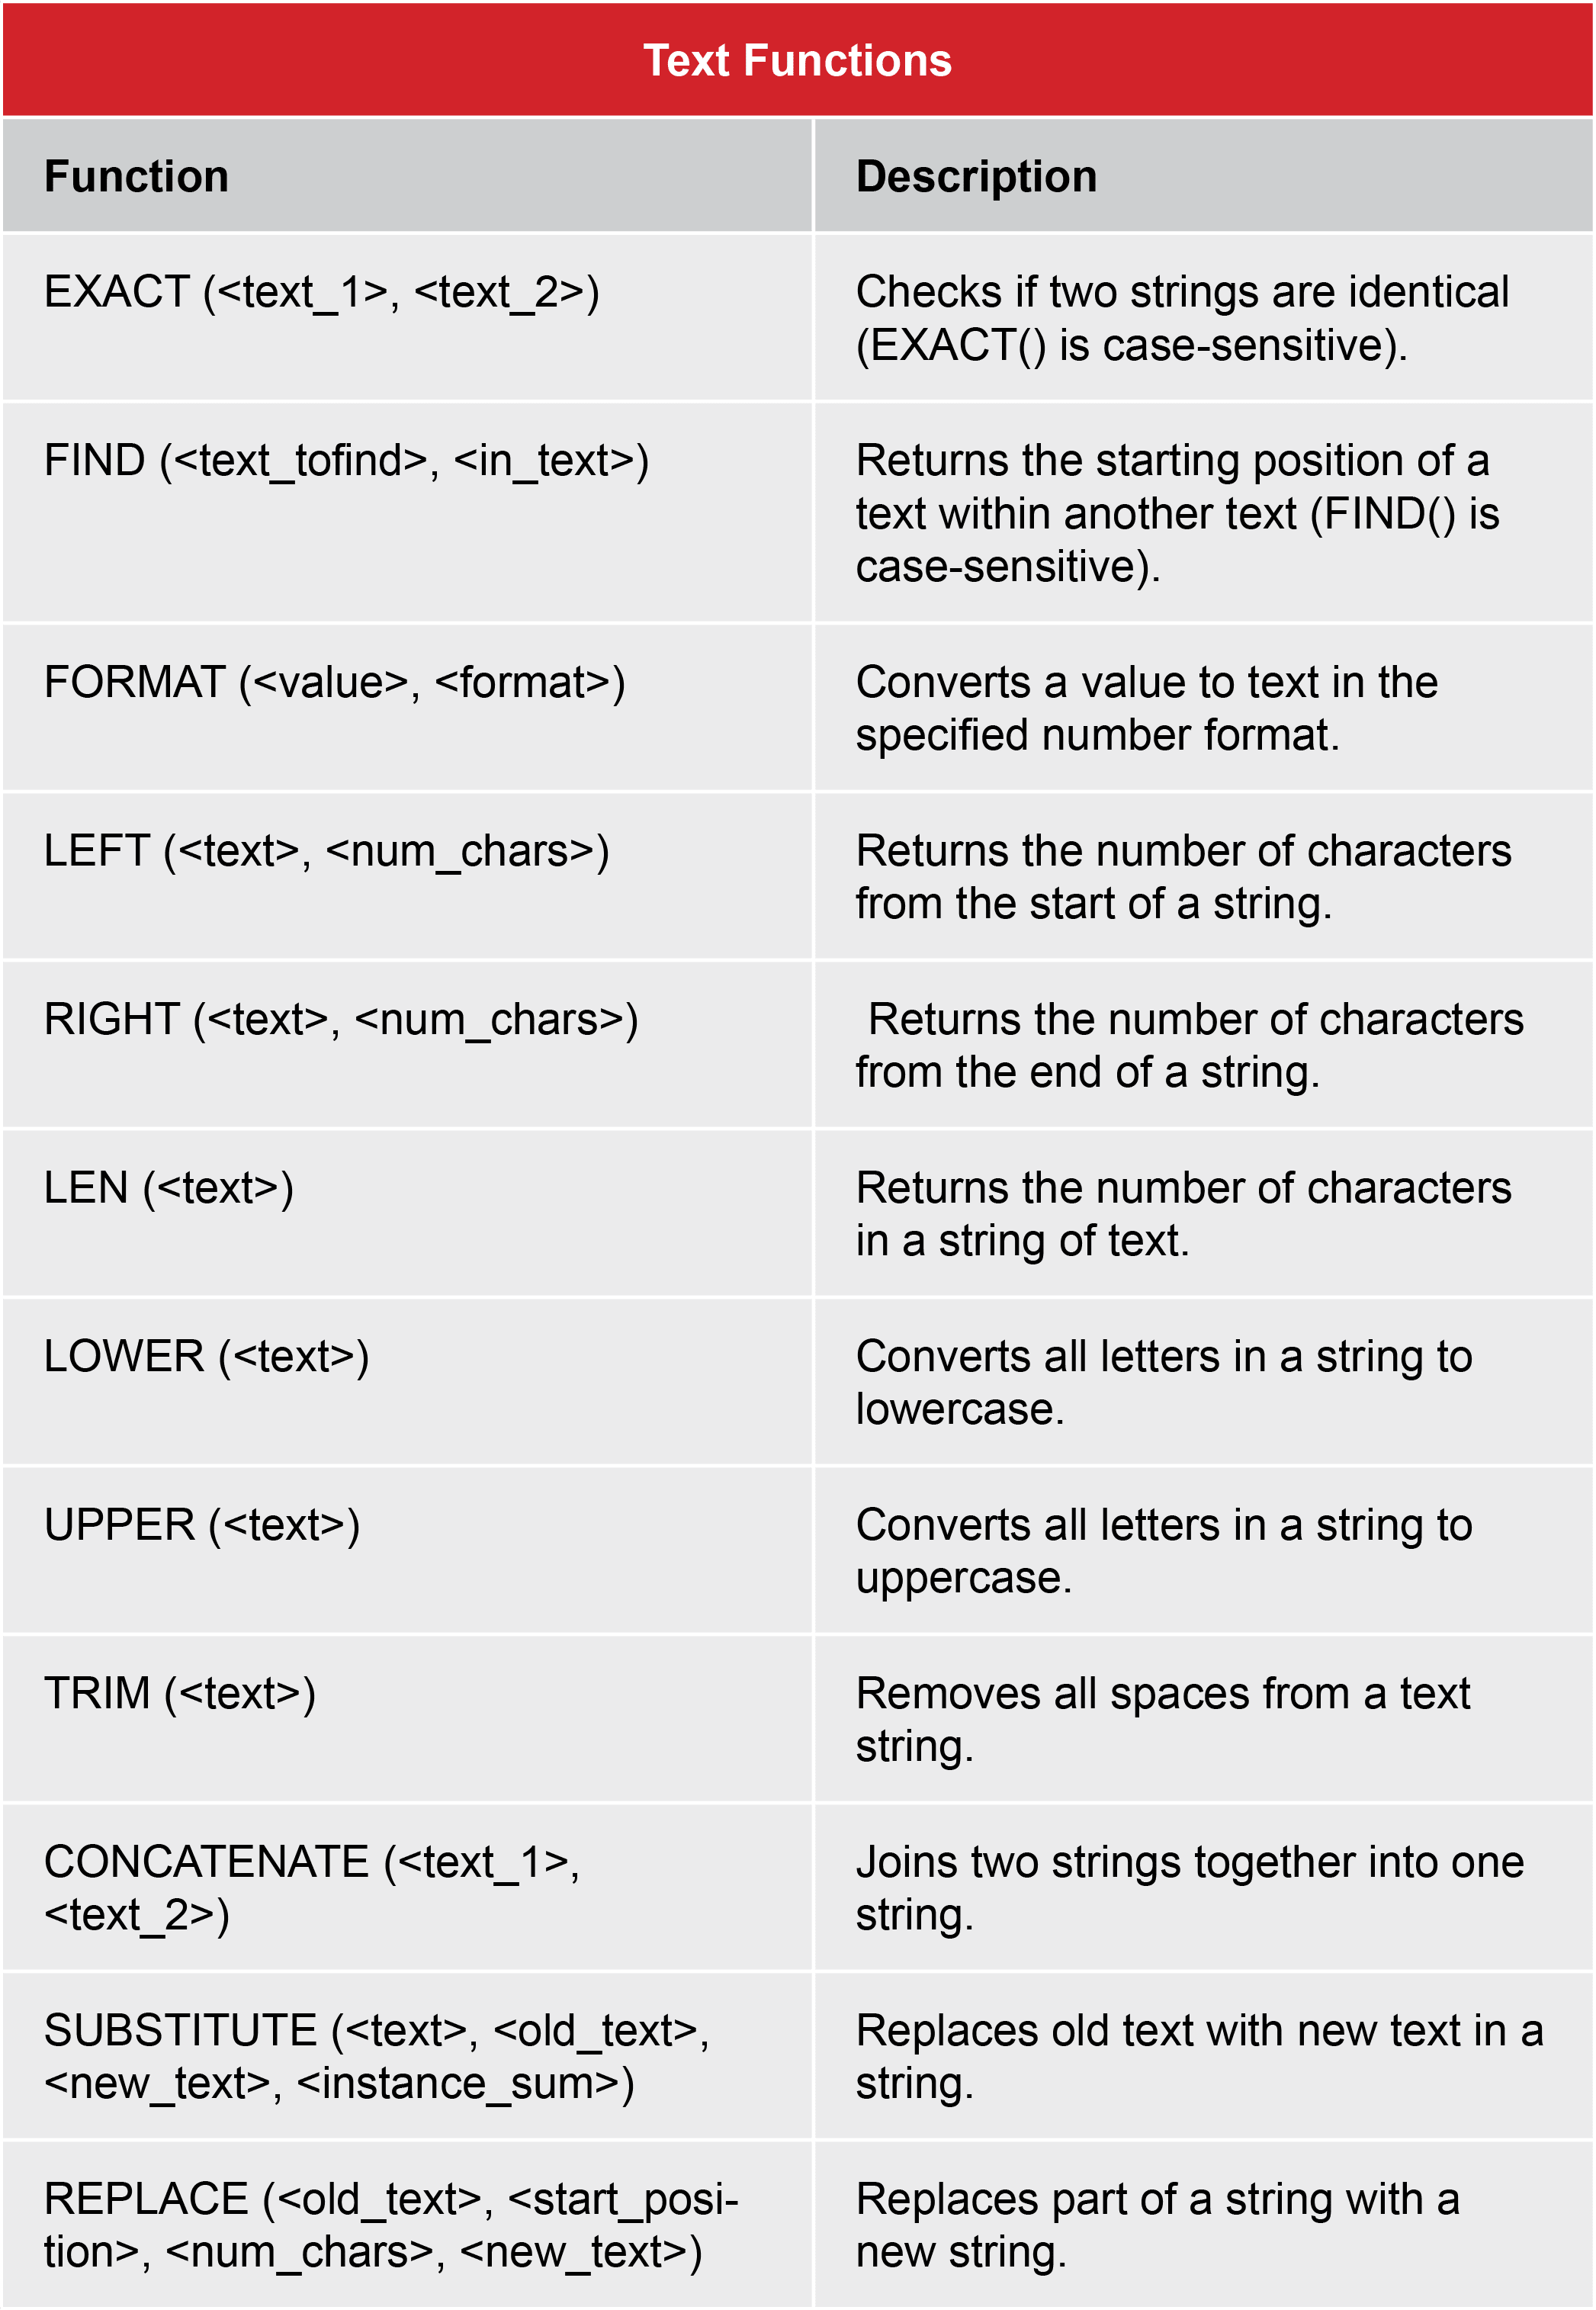
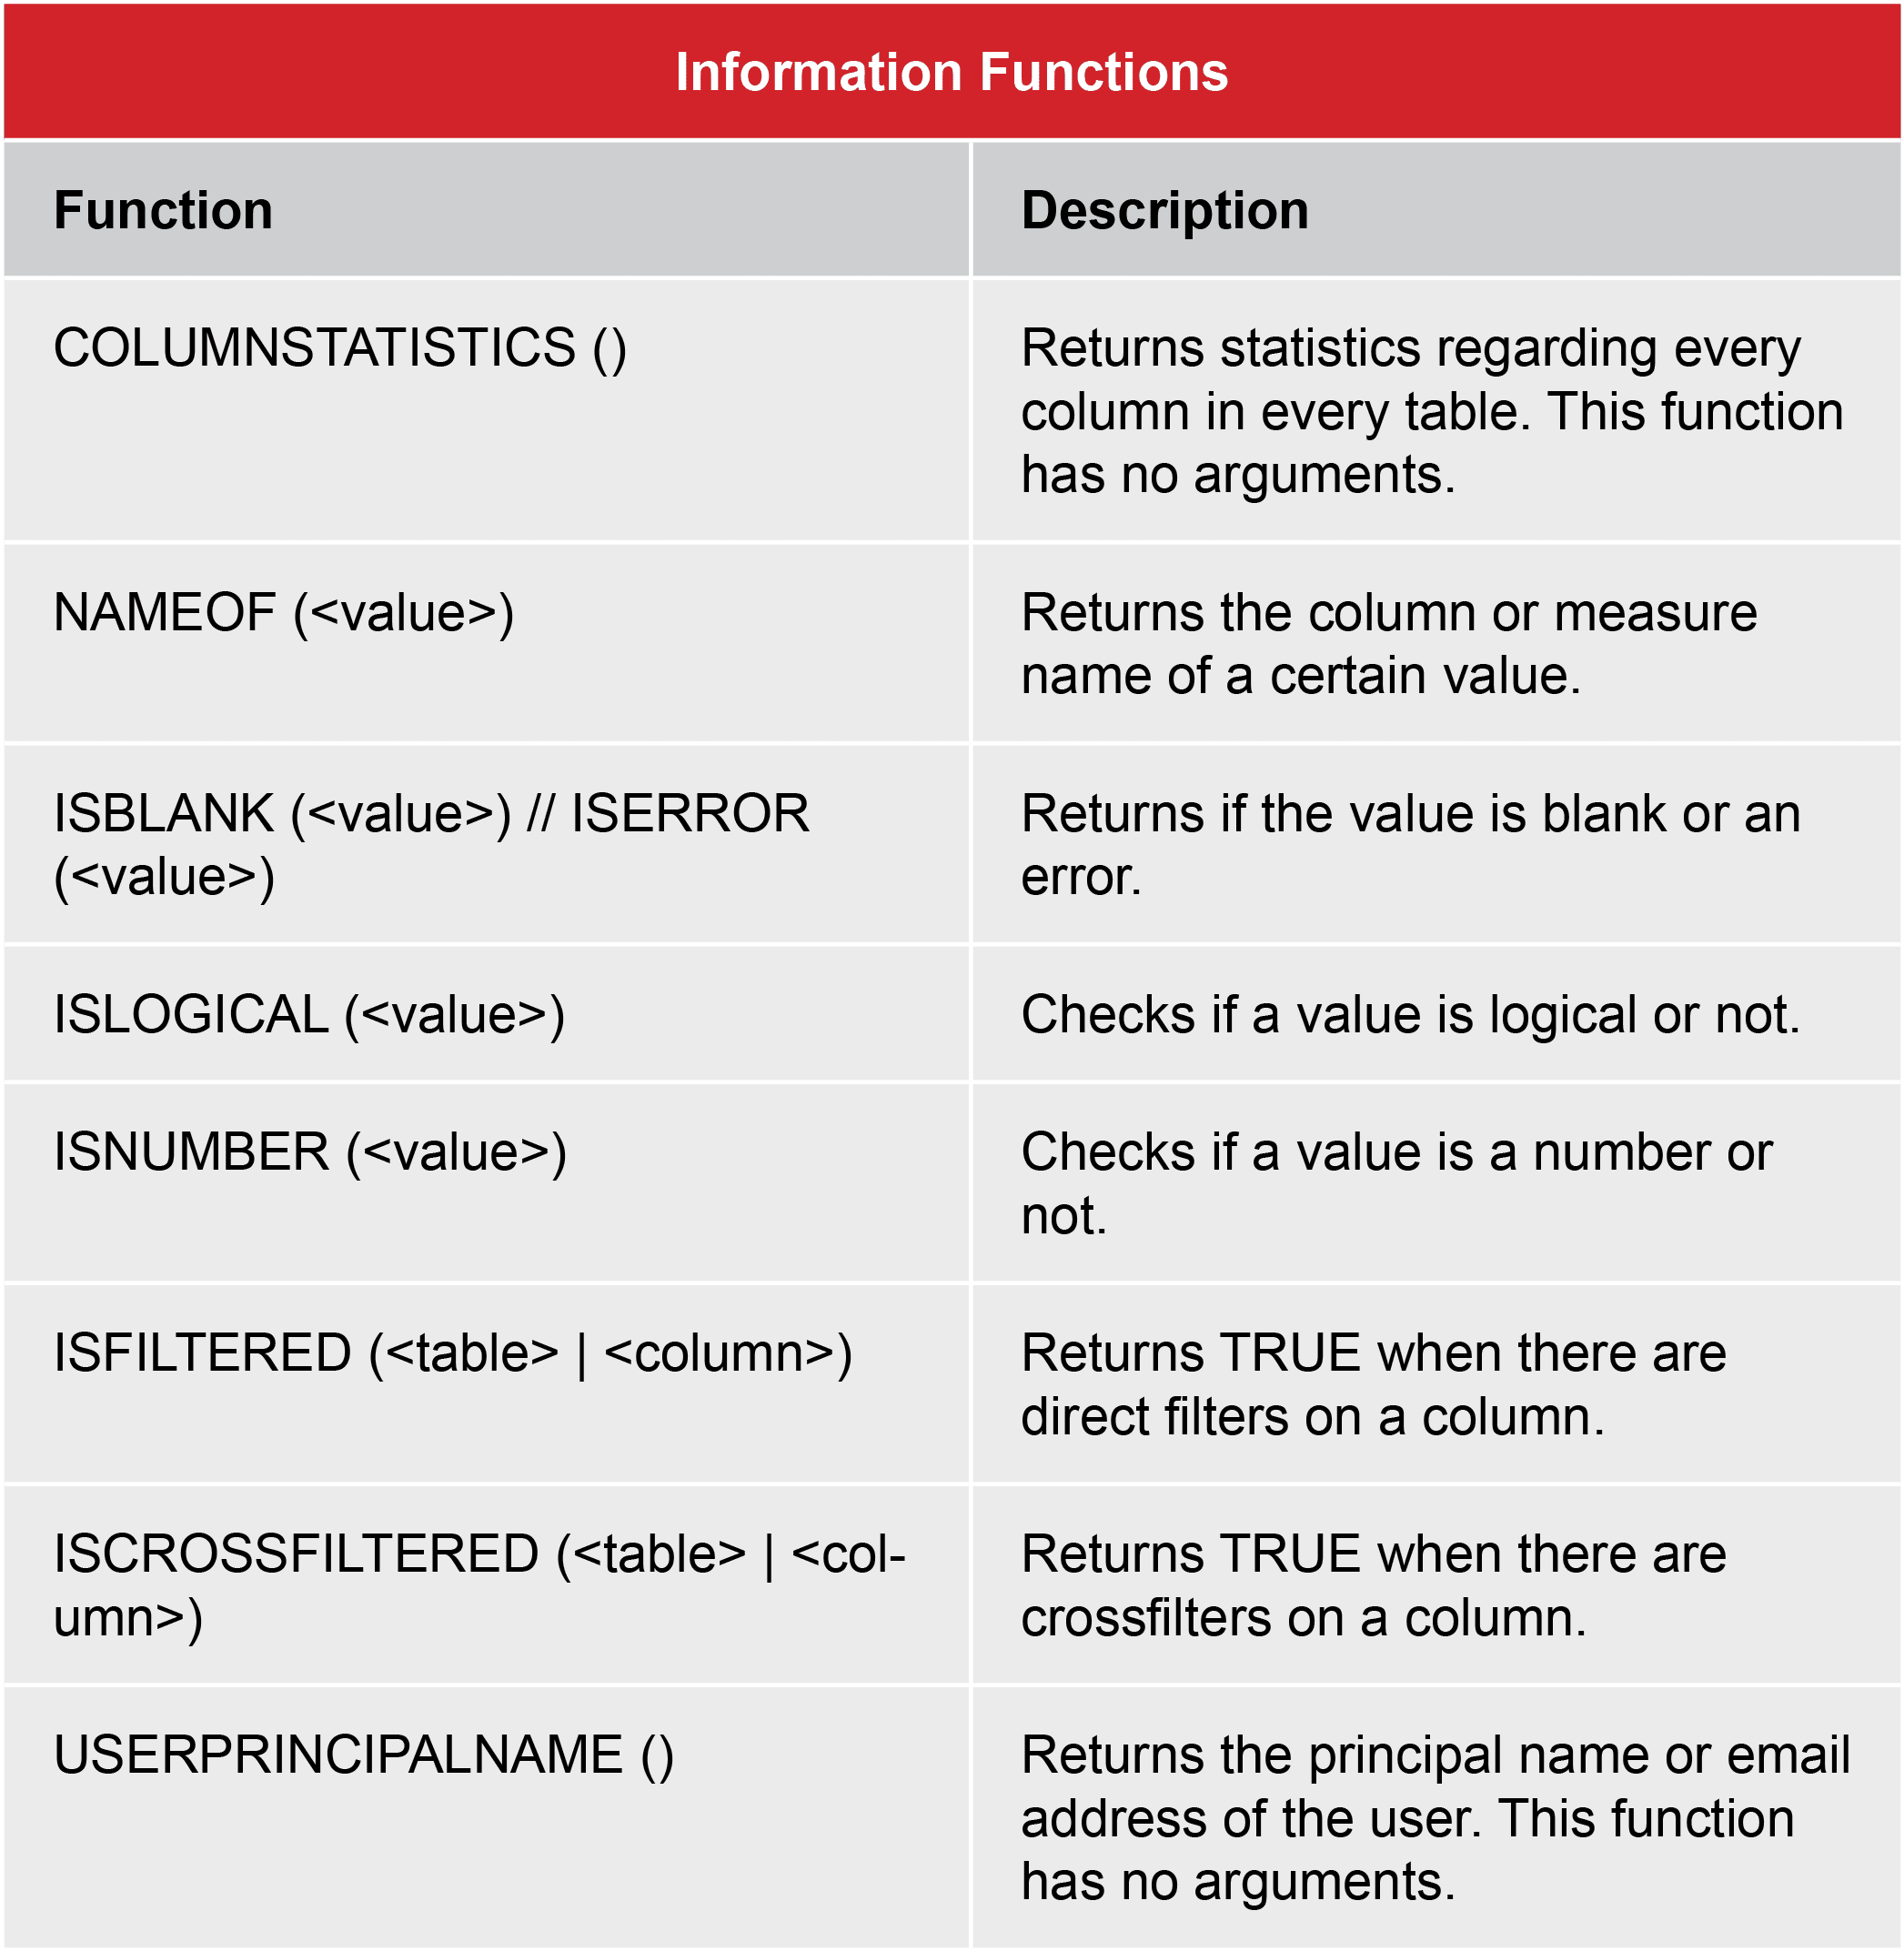
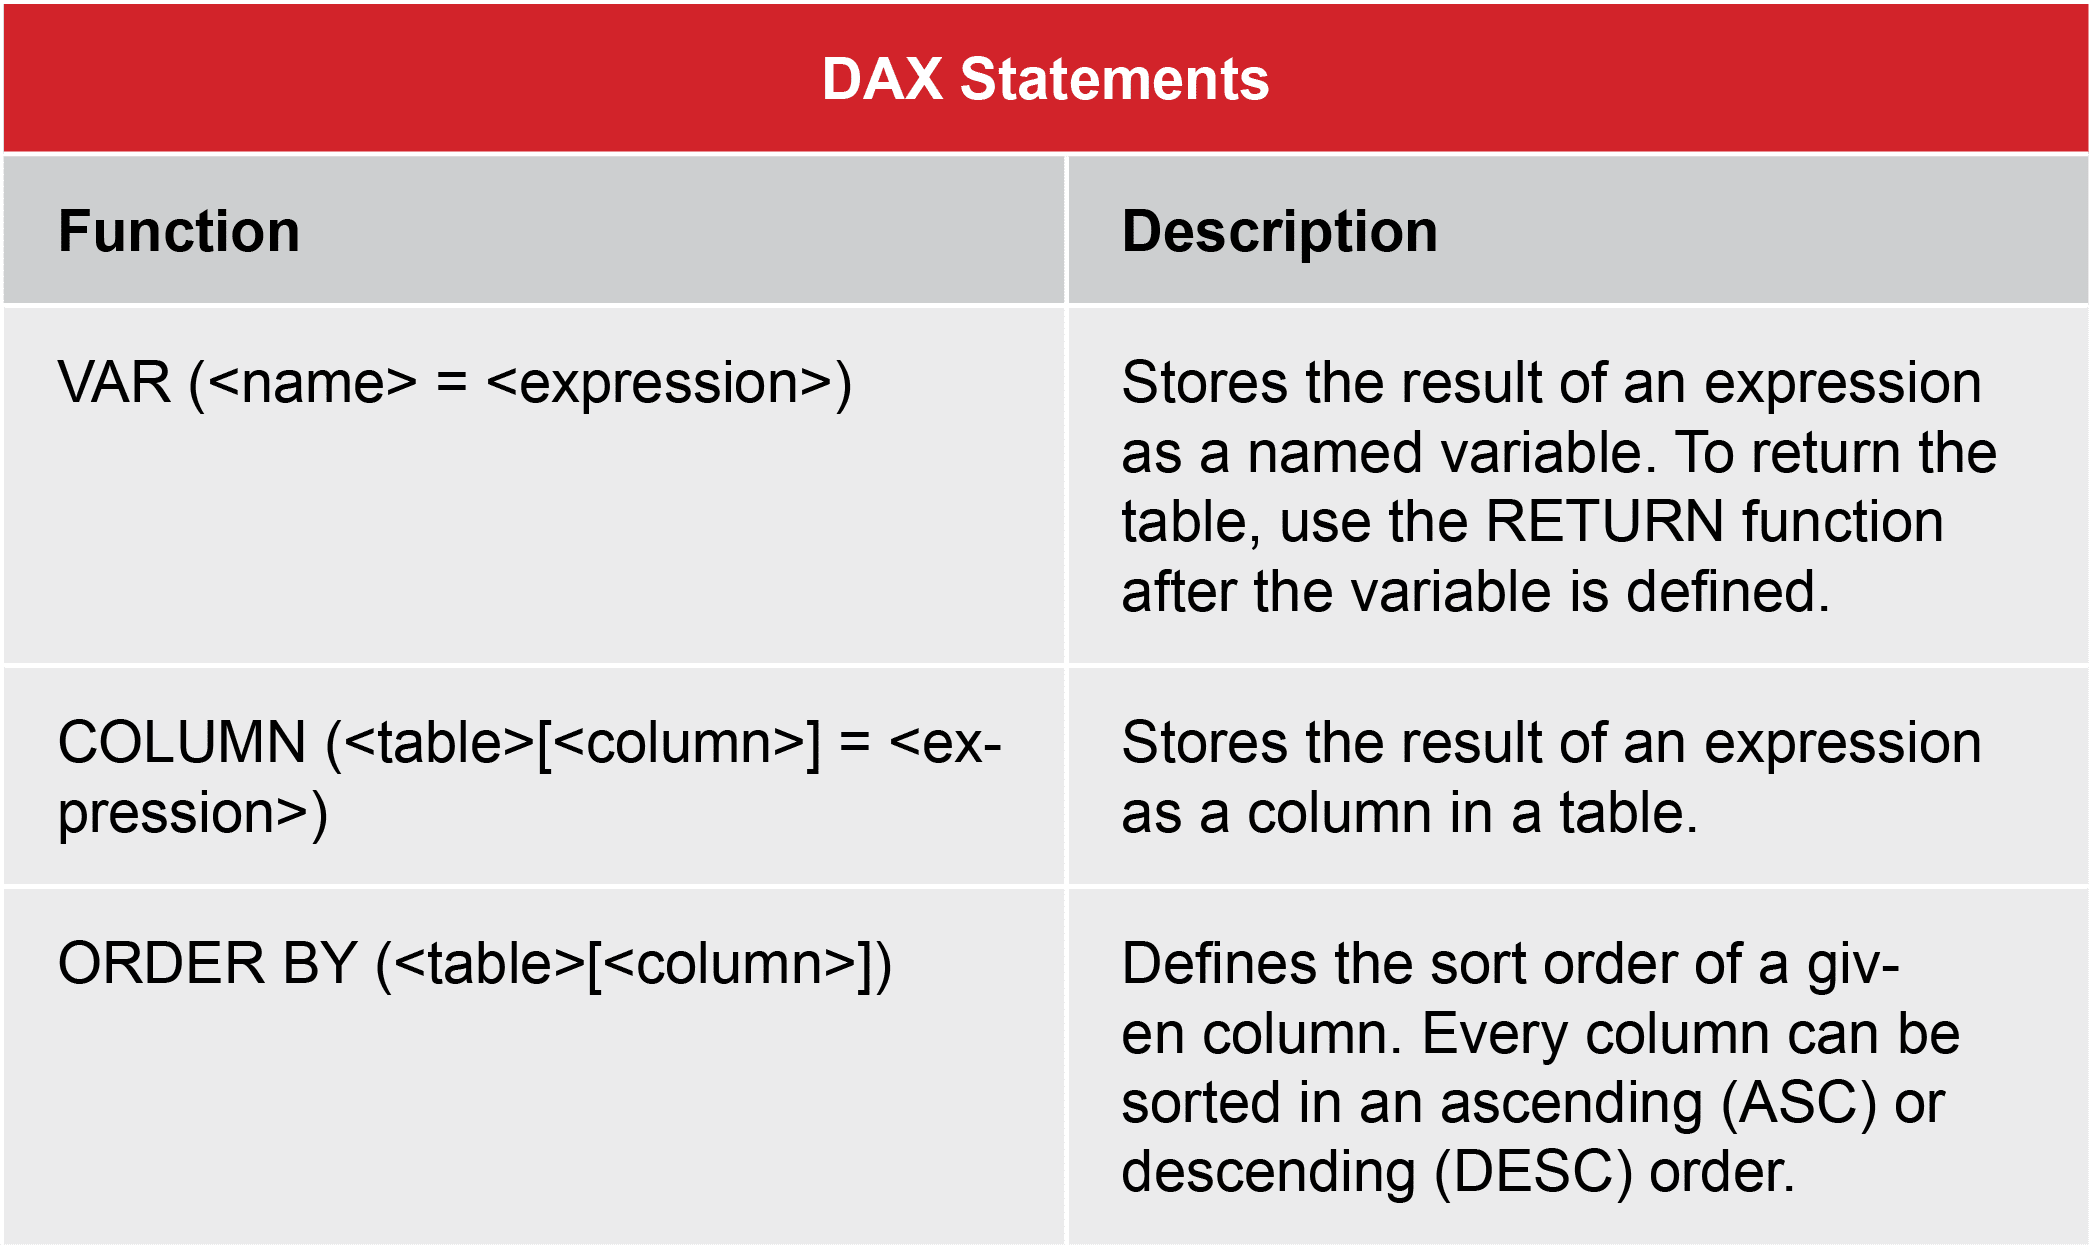
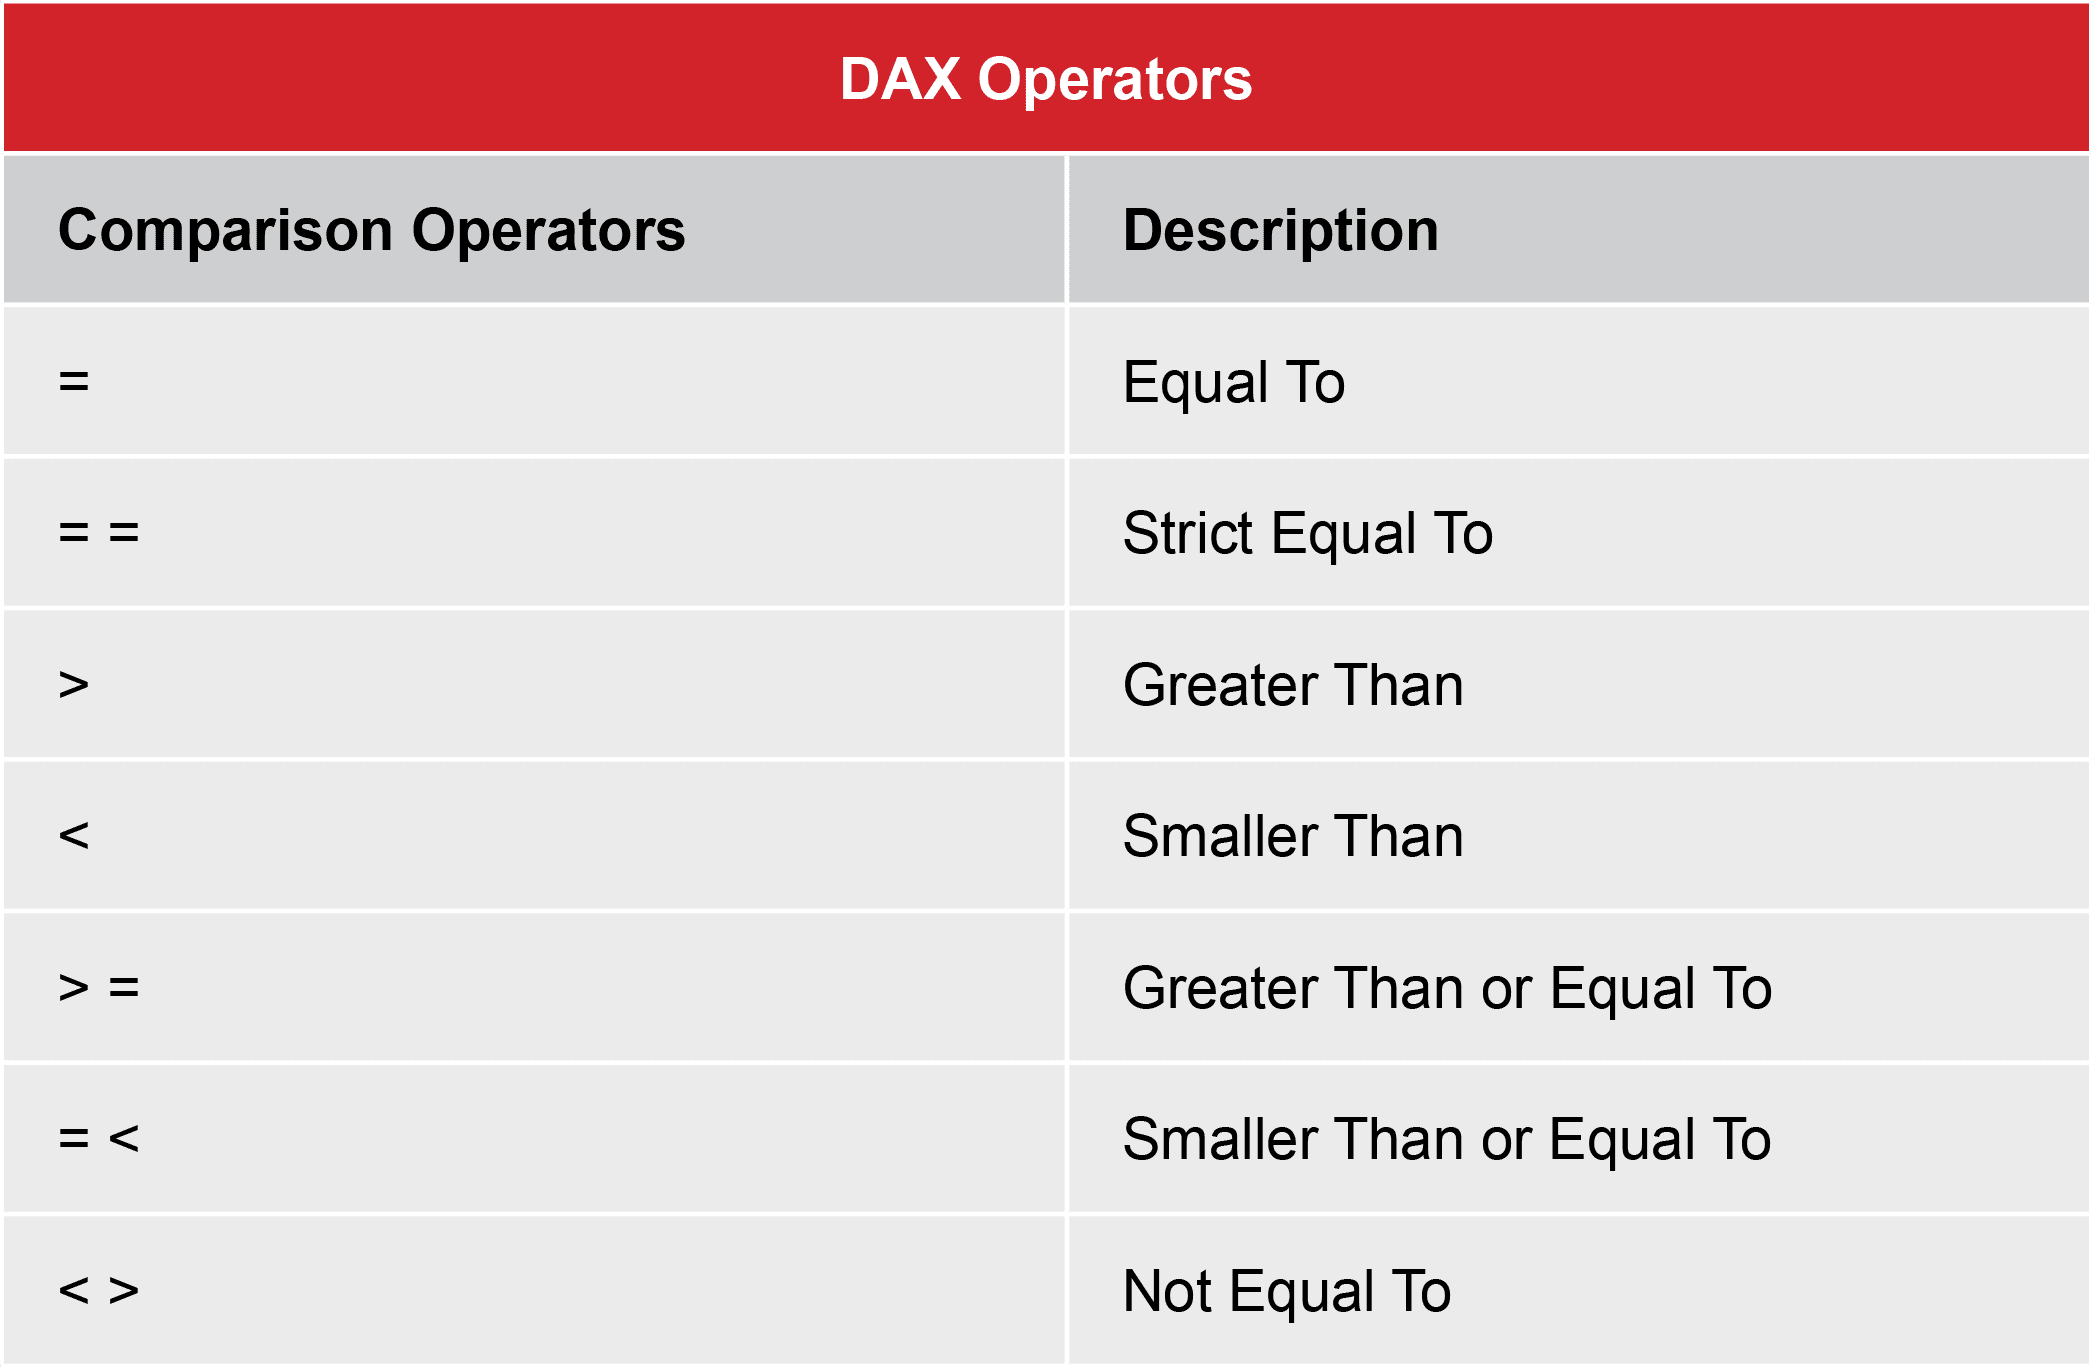
DAX Cheat Sheet
Essentially, both Excel and DAX functions have pros and cons. However, DAX functions in Power BI allow you to perform more advanced and sophisticated calculations and actions, making data analysis and business decision-making more efficient and accurate.
So, if you want to start using DAX or you need a place where you can see all of the functions and formulas in one place, we’ve got you covered!


Conclusion
In this digital age where users across all businesses generate large databases related to work processes, Power BI is an excellent tool for any data-driven organization. It is specifically designed for Business Intelligence and offers advanced functions for data visualization, modeling, and sharing, making it a great choice for all companies that work with big data sets.
Moreover, Power BI is tailor-made for users who analyze data and want to present it dynamically and interactively, especially when working with large and diverse databases. Still, it is worth mentioning that Excel continues to be the most widespread and widely used spreadsheet tool, but it is quite limited when it comes to more advanced functionalities.
If you want to master Power BI and learn how to use its full potential, check out the Data Analyst training at the Data Masters Academy and apply today!
Published: 2 February 2024
Updated: 13 June 2024
